Indicators in XRP revealed that a possible correction is imminent.
Analysts warned of a decline in XRP, Ripple’s token, whose lawsuit with the SEC continues. So, what are the indicators and analysts’ thoughts?
XRP Price Analysis
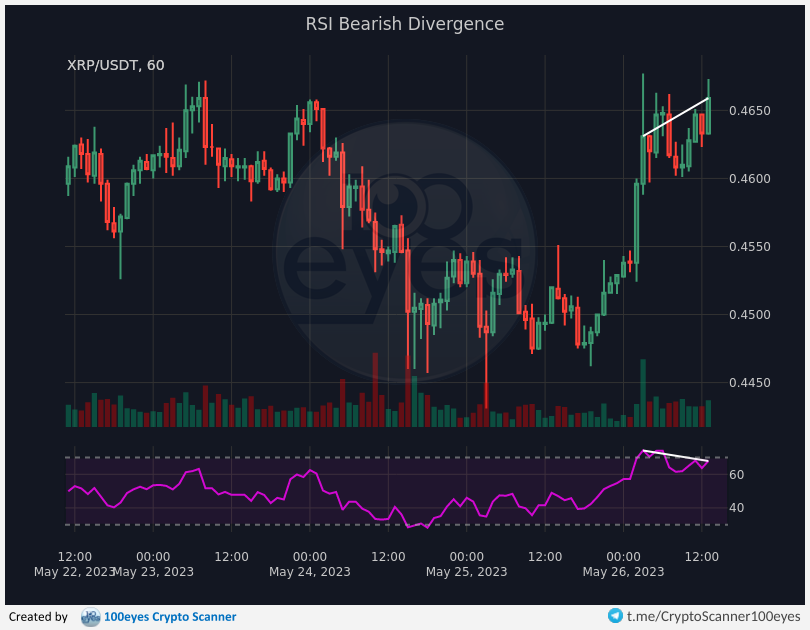
According to information regarding the possible bearish scenario of XRP, the bearish trend noted by analysts of 100eyes Crypto Scanner popular on Twitter is being followed. Technical analysis mentions that when the price of an asset like XRP reaches a new high, a bearish bias can occur.
Conversely, with this downtrend, a momentum indicator such as the relative strength index (RSI) may fail to reach a new high and go bearish. This divergence between price and RSI is often interpreted as a sign that bullish momentum is weakening. It could potentially lead to a price correction or even a full downtrend. As of May 23, XRP price stands at $0.46 after a small 3.3 percent increase in the last 24 hours.

In addition to uncertainties regarding XRP’s price trajectory, Evai CEO Matthew Dixon used causality to predict a significant price drop for the digital asset.
Dixon points out that it could potentially drop as low as $0.34, but does not expect a significant recovery above $0.60. Using Elliot Wave Theory, Dixon thinks this volatility can offer high-risk high-return trading opportunities. Also, Ripple CEO Brad Garlinghouse recently revealed that he envisions a quick resolution to the SEC lawsuit. The resolution of this case, which is a major issue for Ripple, could significantly affect the price of XRP. Therefore, it seems that the path of XRP in the coming weeks is full of potential challenges and opportunities.


