
Important developments and technical analysis are important for many cryptocurrencies. In this article, we will talk about the expectations of analysts for DOGE, FET, ETH, XRP and Bitcoin. Here are the details…
What to expect for DOGE and these four coins?
Bitcoin has not yet shown its “hand”
Bitcoin (BTC) price has rebounded after almost 10 percent loss following the regulatory attack on Binance. While most recoveries point to new momentum, analyst Lockridge Okoth says the situation is different for BTC. Because the largest cryptocurrency remains below the $27,618 foot of the 50-day SMA. In particular, this obstacle has been dominating since May 7. Selling pressure from this level is affecting Bitcoin price unless the bulls turn the 50-SMA to support. It could also push back to retest the local multi-week support of $25,659, where buyers have rebounded for the fourth time.
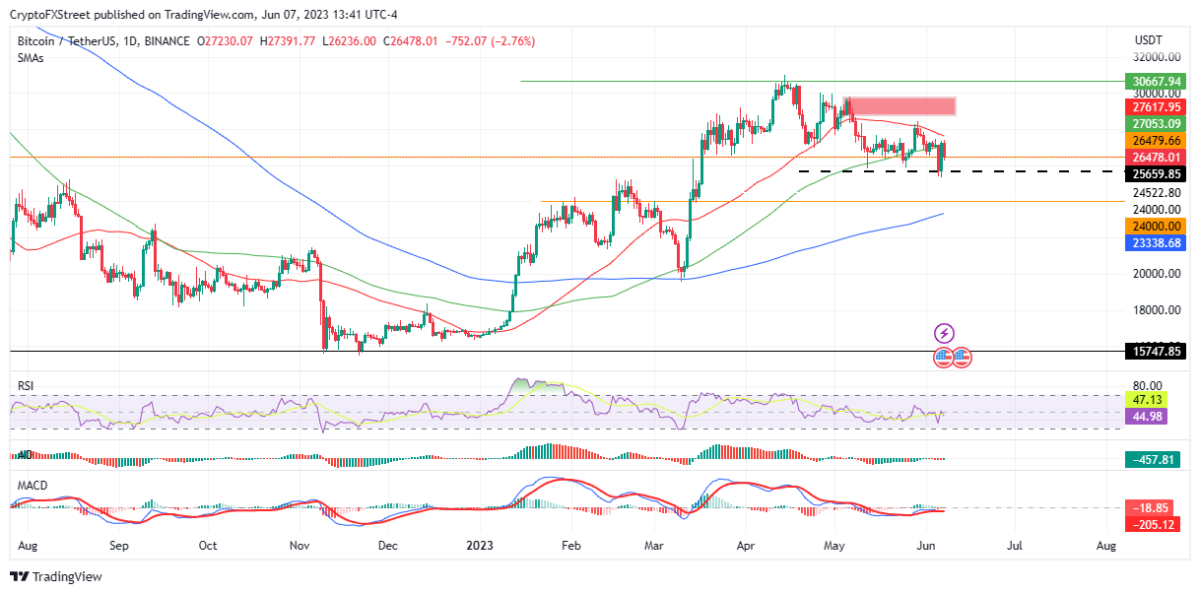
Also, Bitcoin price would need a lot more momentum to break above the supply zone indicated by the red band on the chart. Selling pressure from this region is expected to invalidate any bullish attempt. The Relative Strength Index (RSI) is considered to be heading down to show some falling momentum. Therefore, BTC holders and traders may have to wait longer. However, bulls defeating the bears will push the Bitcoin price beyond the seller-dominated zone, drawing liquidity above it.
No directional trend for Ethereum
Ethereum (ETH) price has filled a symmetrical triangle after weeks of consolidation with increased volatility. However, contrary to expectations, the altcoin still lacks a directional trend after escaping the technical formation. A breakout could occur for ETH if Ethereum price rises above the 50-SMA and reaches $1,857. This marks the first step to the north. However, a daily candlestick close above the $2,128 resistance level will only confirm the bullish view.
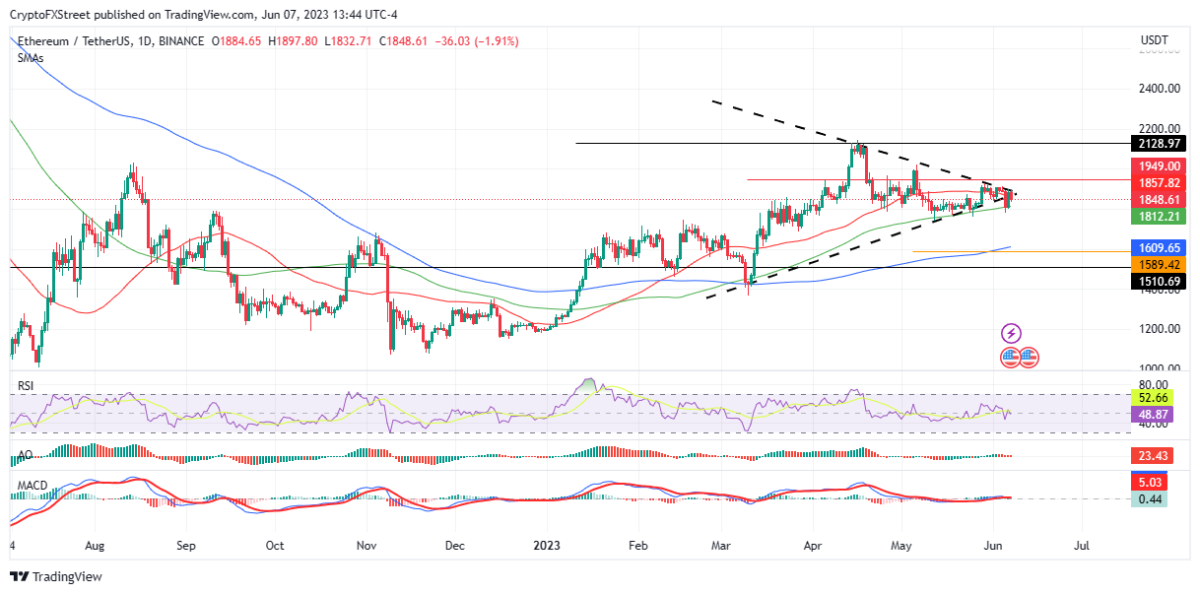
However, this is highly unlikely in the short term given the need for more momentum with the RSI showing at 49 and moving south. Confirmation should be sought above the $1,949 level. Conversely, as Ethereum price drops below the 100-day SMA, the buying pressure from this supplier level continues to bode well for ETH. This could spell doom for ETH bulls in the short term.
Ripple price faces tight track
Ripple (XRP) price has abandoned its upward impulsive move, dropping nearly 10 percent from the intraday high of $0.547 recorded on June 4. The correction took place as ETH continued to find selling pressure to limit its rise from the $0.542 level. According to the analyst, this region in particular has limited the upward movement of XRP for months. The ensuing correction drove the token’s market value down by double-digit percentages.
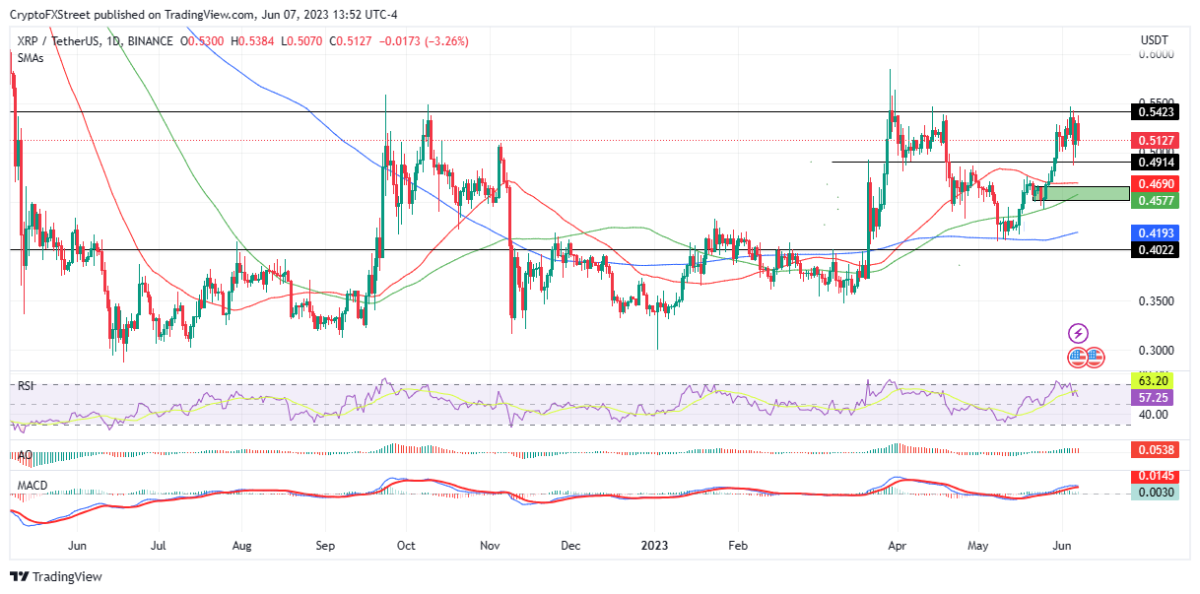
Failure of this zone to turn into support could see Ripple price drop towards the demand zone before starting a recovery rally supported by the demand zone. However, the Relative Strength Index points to a declining momentum that will see the market cap of XRP plummet. On the other hand, a flow in buyer momentum allows Ripple price to break above the $0.542 roadblock. Then it opens the way for more earnings.
DOGE price hits 2023 lows: What’s next?
Meanwhile, the price of Dogecoin (DOGE) has dropped 10 percent compared to a month ago. Dogecoin (DOGE) price, like most coins, entered a downtrend on Monday as investors reacted to the SEC lawsuit against Binance and Coinbase. But yesterday, DOGE posted a slight 2% rebound as long-term investors became reluctant to post further losses. The IntoTheBlock chart below shows how the number of “diamond hand” addresses holding DOGE has increased significantly over the past month.
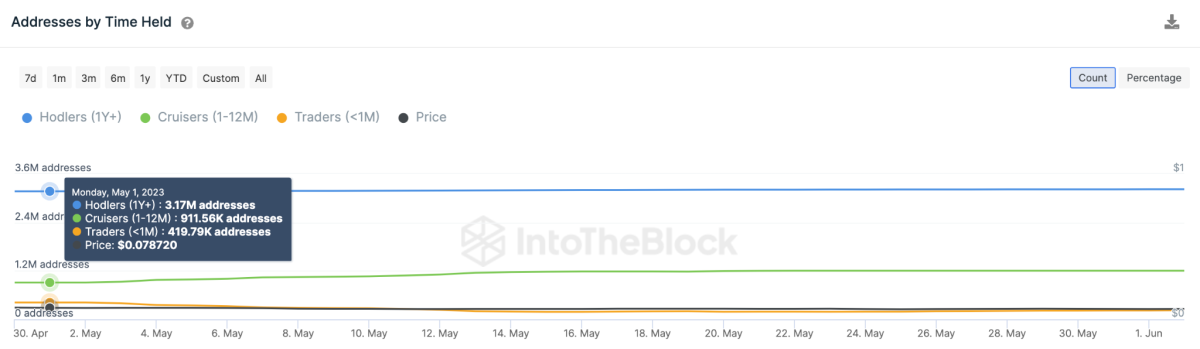
Between May 2 and June 7, the number of long-term holders of Dogecoin increased by 50,000 addresses. Meanwhile, short-term trader addresses decreased by 224,000 addresses. The data presented above shows that the recent selloff, which saw the DOGE price drop below $0.065 this week, was largely driven by short-term traders coming out of their positions. If long-term investors remain firm, DOGE will likely defend the $0.060 support level. In further confirmation of the bullish outlook, the exchanges’ order books show that investors are looking to capitalize on the drop around $0.060.
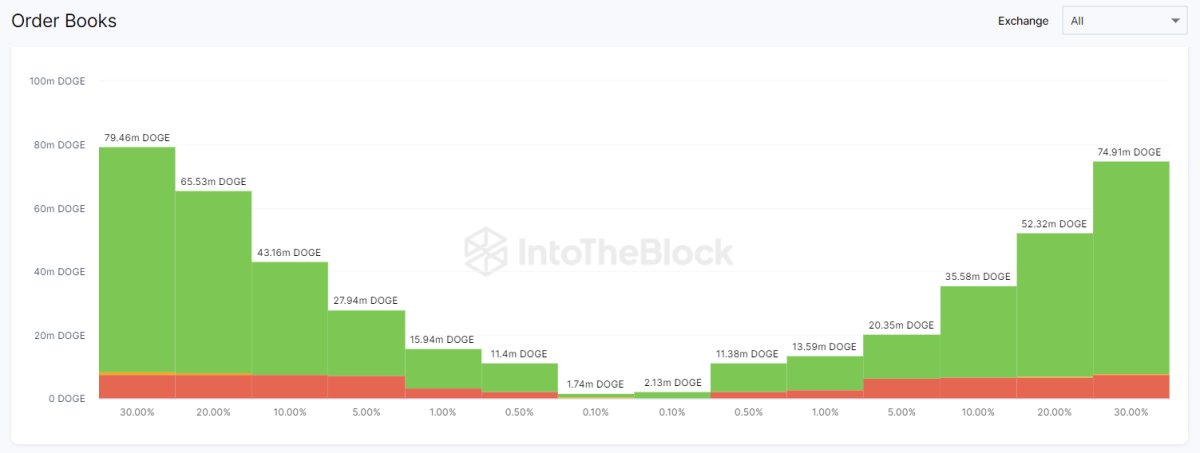
When demand exceeds the available supply in exchanges, competition increases, ultimately causing the price to rise. There is currently a supply gap of 55 million DOGE. This means that the price will recover early as buyers start competing. All in all, supply shortages and confidence from long-term holders are two factors that could trigger an early Dogecoin recovery. The bears could thwart this optimistic narrative if DOGE price drops below $0.065 again. However, investors placed orders to buy 33.2 million DOGE when the price fell 5% to $0.064. According to analysts, the buy wall will likely prevent the price from falling further. If this resistance does not hold, DOGE will likely fall to a new low of $0.060 in 2023.
Will the bulls prevail for the FET?
Despite the bearish start where the price of fetch.ai (FET) fell to a 24-hour low of $0.234, the bulls have regained market dominance. It pushed the price to its intraday high of $0.2513. The bulls’ attempts to reclaim market control were admirable. However, the resistance around $0.2513 was too much for them to overcome. If the negative momentum surpasses the intraday low of $0.234, FET will find support around $0.221. However, if the bulls can push the price above the $0.2513 resistance, the next resistance will be $0.2667.
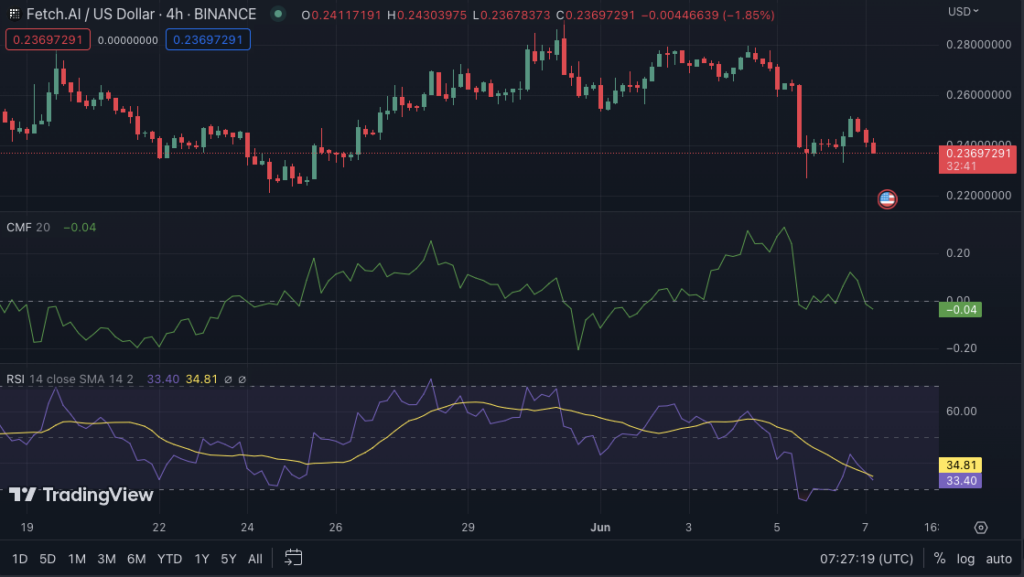
When the Chaikin Money Flow enters negative territory, it indicates that selling pressure is increasing and the price will fall. As a result, a Chaikin Money Flow value of -0.04 on the FET 4-hour price chart shows that capital outflows now outweigh entries. The RSI is below the signal line at 33.53, adding to the negative mood. Also, traders use the Elder Force Index to measure the strength of the uptrend. They compare the number of stocks rising with the number of stocks falling.
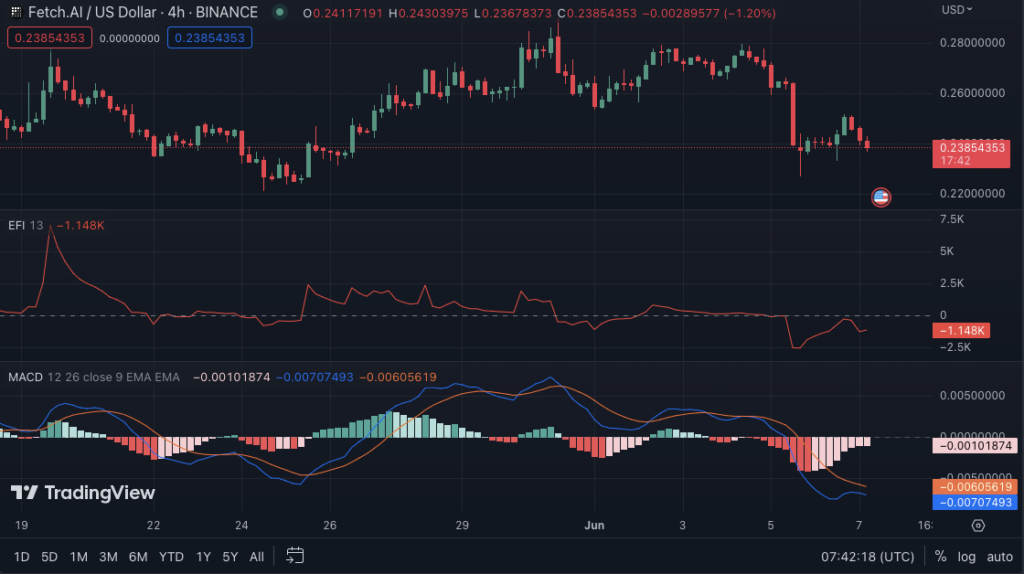
When the Elder Force Index rises, stocks are in high demand. Buyers dominate the market. As a result, it is critical that the Elder Force Index on the FET/USD price chart is in negative territory with a value of -1.149. According to analysts, it indicates that the market is under downward pressure. However, as it is increasing, the negative pressure may decrease and eventually give way to positive momentum. As a result, despite the setbacks, Fetch.ai (FET) marks a shift from bearish to positive momentum, according to analysts. With these indicators, it remains poised for a potential market turnaround.