The US Consumer Price Index (CPI) rose 8.2 percent year-on-year in September, beating economists’ expectations for an 8.1 percent increase. CPI pressure reached the hype and caused a sharp but short-term increase in variable risk assets. Cryptocurrencies fluctuated. So, what’s next for altcoins like MATIC, DOGE and Bitcoin in the coming days? Here are analyst Rakesh Upadhyay’s analysis…
Bitcoin analysis before altcoins like MATIC, DOGE
Bitcoin broke support at $18,843 on October 13 and dropped close to $18,125. This level attracted purchases that started a sharp recovery. Buyers pushed the price above the moving averages on Oct. 14, but the upward move is facing stiff resistance at the downtrend line. The 20-day EMA ($19,466) is flattening and the relative strength index (RSI) is near the midpoint, showing the balance between buyers and sellers.
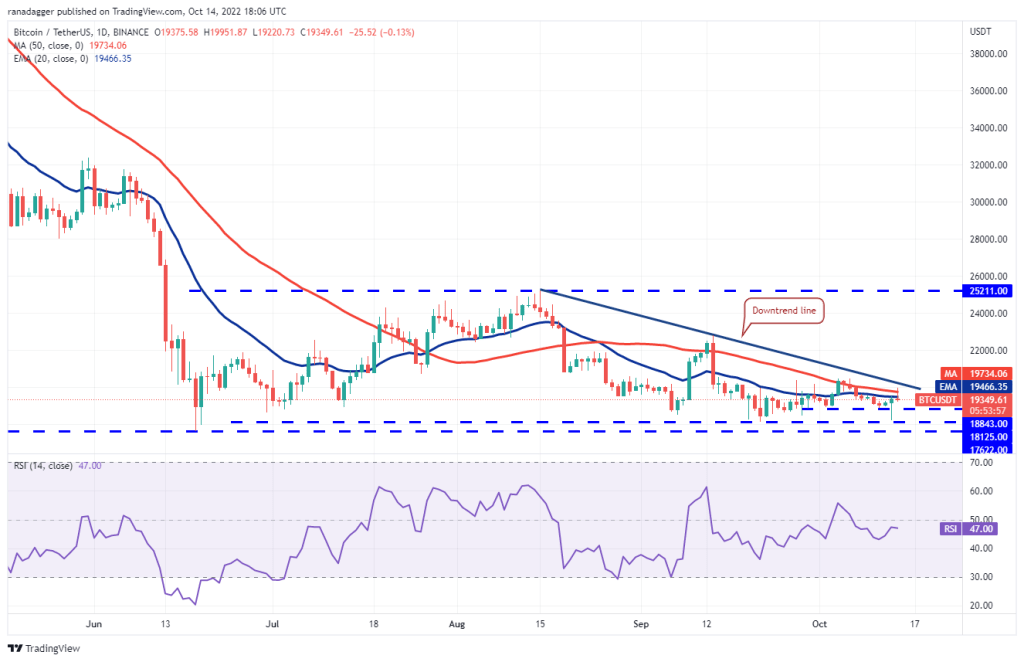
According to the analyst, this balance will turn in favor of the bulls if it propels and sustains the price above the overhead resistance of $20,500. The BTC/USDT pair could rally to $22,800 later. Bears are expected to show stiff resistance at this level. If the price stays below the 20-day EMA, the bears will attempt to push the pair back below $18,843 and challenge the support at $18,125.
What’s next in leading altcoin Ethereum?
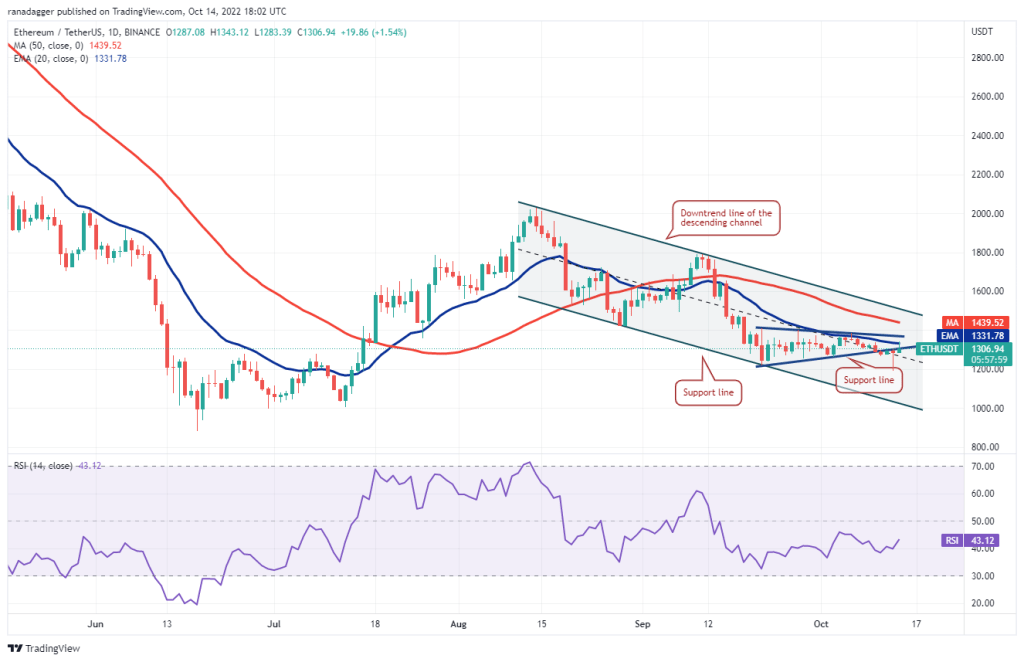
Ethereum dropped below support at $1,220 on October 13 but the bears failed to keep the price low. The bulls bought the lows fiercely and formed a “hammer candlestick” pattern. Buyers continued the positive momentum on Oct. 14 and are attempting to push the price above the general zone between the 20-day EMA ($1.331) and the resistance line of the triangle. If they can achieve this, the ETH/USDT pair could attempt a rally towards the downtrend line of the descending channel pattern. The bulls will need to break through this hurdle to signal a potential trend change. The bears are likely to have other plans. They will try to stop the recovery in the overhead region and then try to push the pair below $1,190.
What’s next for Binance Coin?
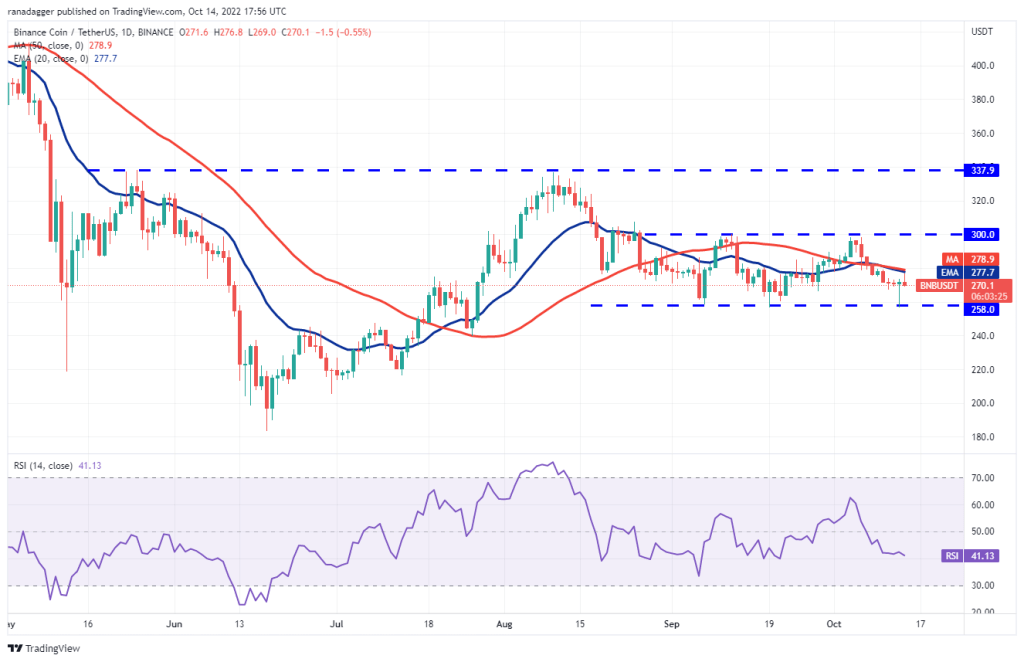
BNB has been range-tied between $300 and $258 for the past few days. In a range, traders usually buy near the support and sell near the resistance. This is what happened on October 13 when the bulls bought the dip for $258. Buyers tried to push the price above the moving averages on October 14, but the long wick on the candlestick indicates that the bears are selling close to the resistance levels. The bears will again try to push the price below $258 and extend the decline to $216. Conversely, if the price rises and rises above the moving averages, the BNB/USDT pair may attempt a rally towards the overhead resistance at $300. A break above this level could set the stage for a rally to $338.
Will Ripple (XRP), which has been rising all week, maintain its momentum?
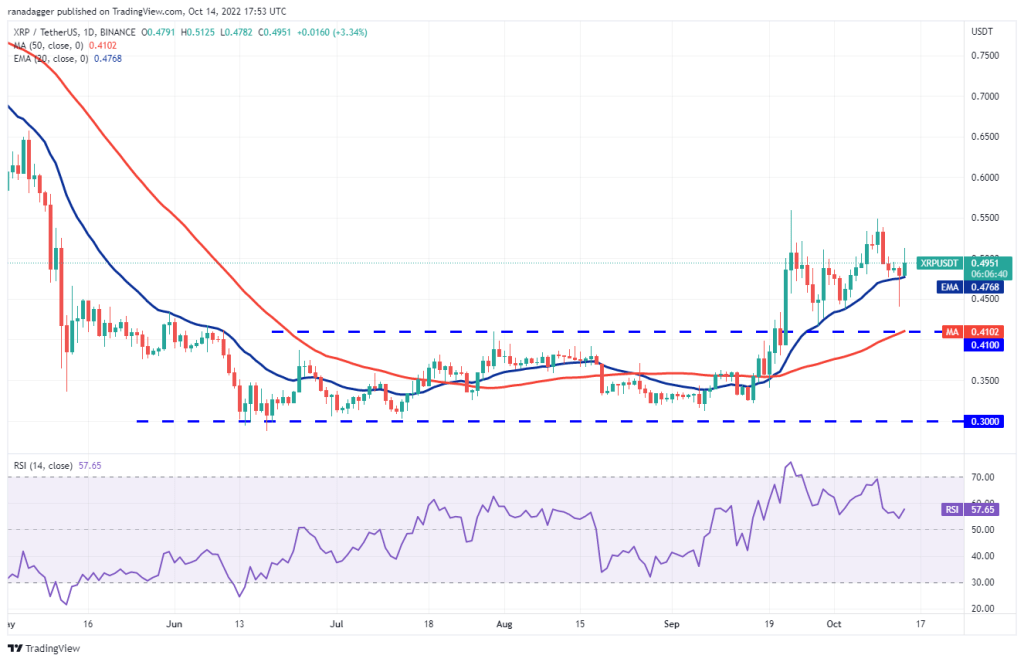
XRP fell below the 20-day EMA ($0.47) on Oct. 13, but the bears failed to sustain lower levels. The bulls bought the dip and pushed the price above the 20-day EMA. Both moving averages are rising and the RSI is in the positive zone giving the buyers an advantage. The bulls will try to push the price above the overhead resistance at $0.56. If this happens, the XRP/USDT pair could resume its uptrend and rally towards the next overhead resistance at $0.66. The first sign of weakness would be a break and close below the 20-day EMA. This indicates that traders can book profits at higher levels. The pair could slide to the breakout level of $0.41 later.
Levels to watch out for for Cardano (ADA)
Cardano found buy support at $0.35 on October 13, but the bulls are struggling to push the price above the $0.40 break on October 14. The 20-day EMA ($0.41) continues to drop and the RSI is in the oversold zone. This shows that the bears are under control. If the price continues to decline and dips below $0.35, it indicates that the bears have turned $0.40 into resistance. This could increase the possibility of a drop to $0.33.
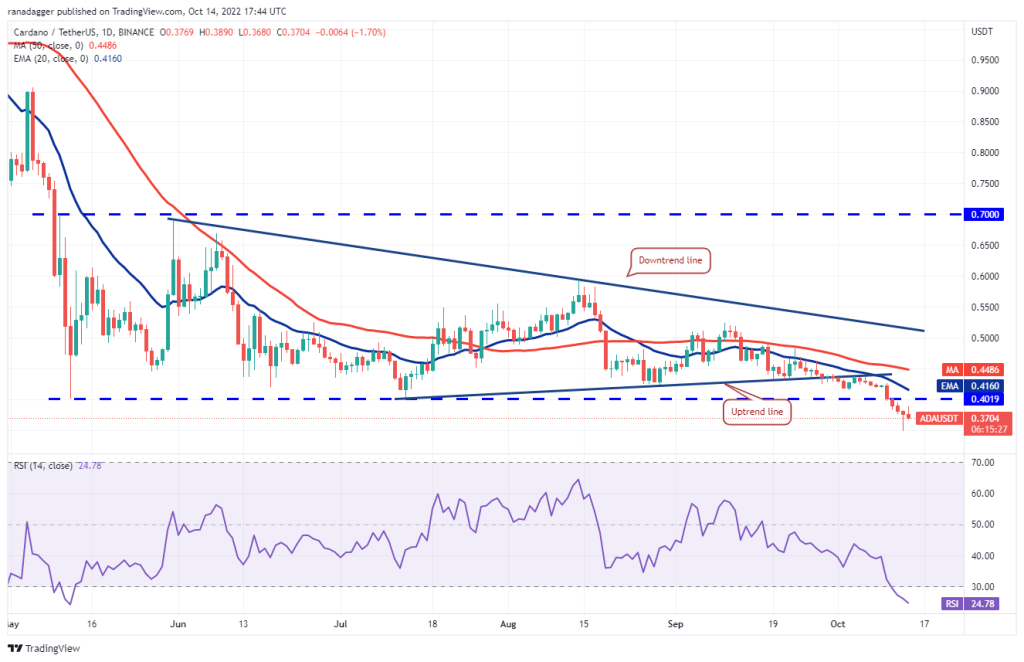
This bearish outlook could change in the near term if buyers push the price above the moving averages. This will indicate strong accumulation at lower levels. The ADA/USDT pair could then climb to the downtrend line.
Prospects for Solana (SOL)
Solana broke below the $30 support on Oct. 13, but the bears failed to develop that strength. It lowered the price to vital support at $26. The bulls stopped the decline at $27.87 and pushed the price above $30. Buyers tried to extend the positive momentum on October 14 but faced heavy selling near the downtrend line as seen from the long wick on the candlestick. The bears will now try to push the price below $30 again and extend the decline to $26.
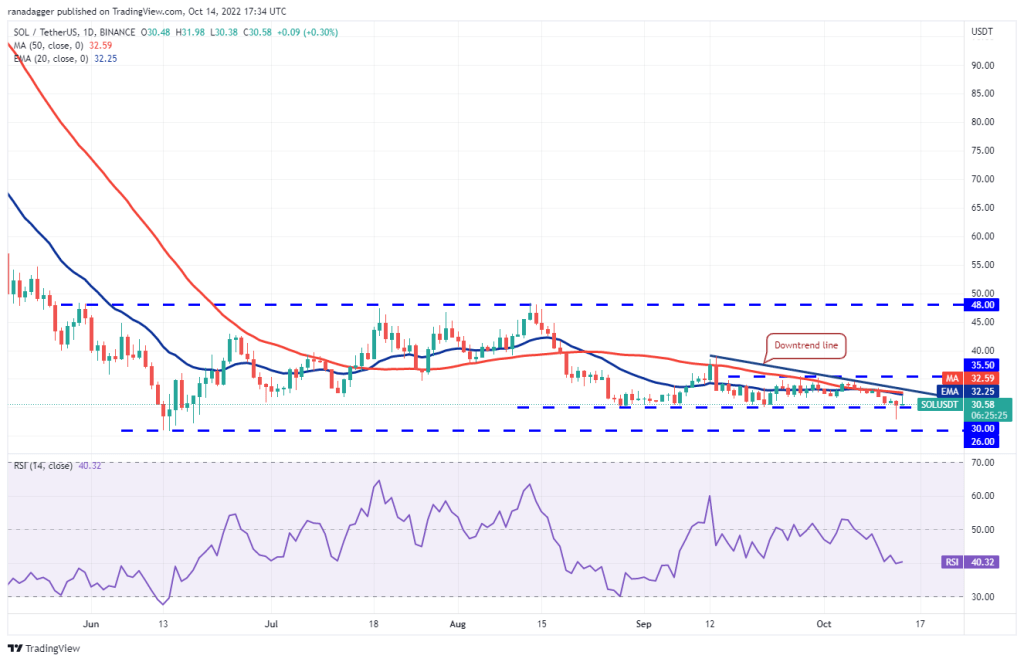
If the bulls want to invalidate this bearish view, they will have to quickly push the SOL/USDT pair above the downtrend line. This could result in a possible rally at $35.50. It could then open its way to $39, where the bears can offer strong resistance again.
Moving on to the last altcoin Polygon (MATIC): bulls active in DOGE
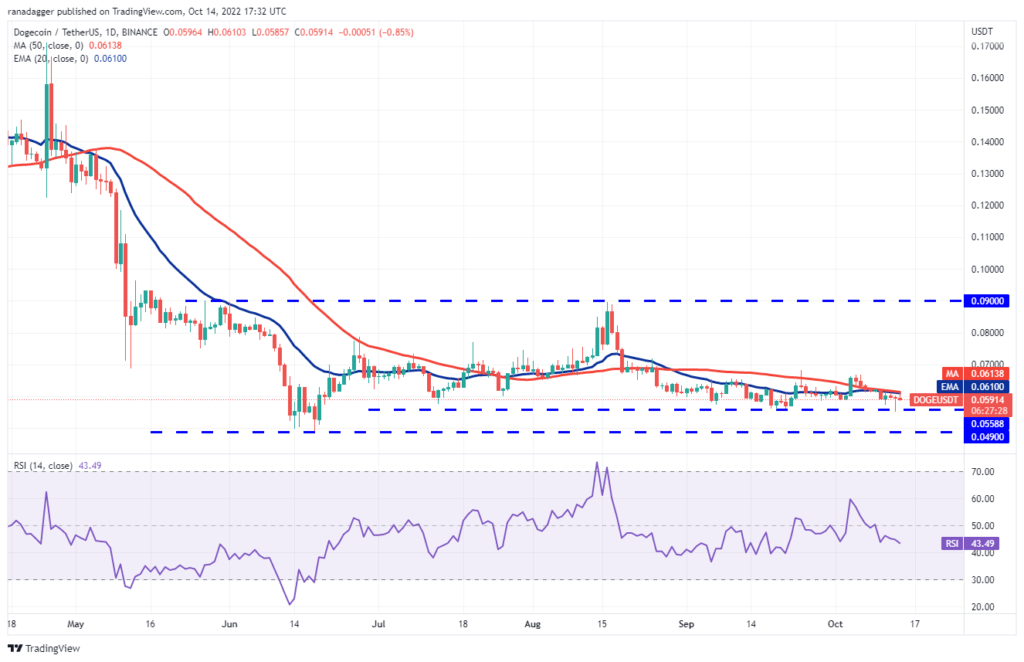
Dogecoin recovered strong support near $0.06 on October 13, showing that the bulls are aggressively holding the level. Buyers are trying to push the price above the moving averages on October 14. If they do, the DOGE/USDT pair could rally to $0.07. This level is likely to act as a strong resistance again, but if the bulls push the price above it, the pair may attempt a rally towards the $0.09 overhead level. Conversely, if the price declines from the moving averages, the bears will try to push the price back below the support around $0.06. This is an important level for the bulls to defend because if it breaks, the pair could retest June’s low around $0.05.
Last coin on the list: Polygon (MATIC)
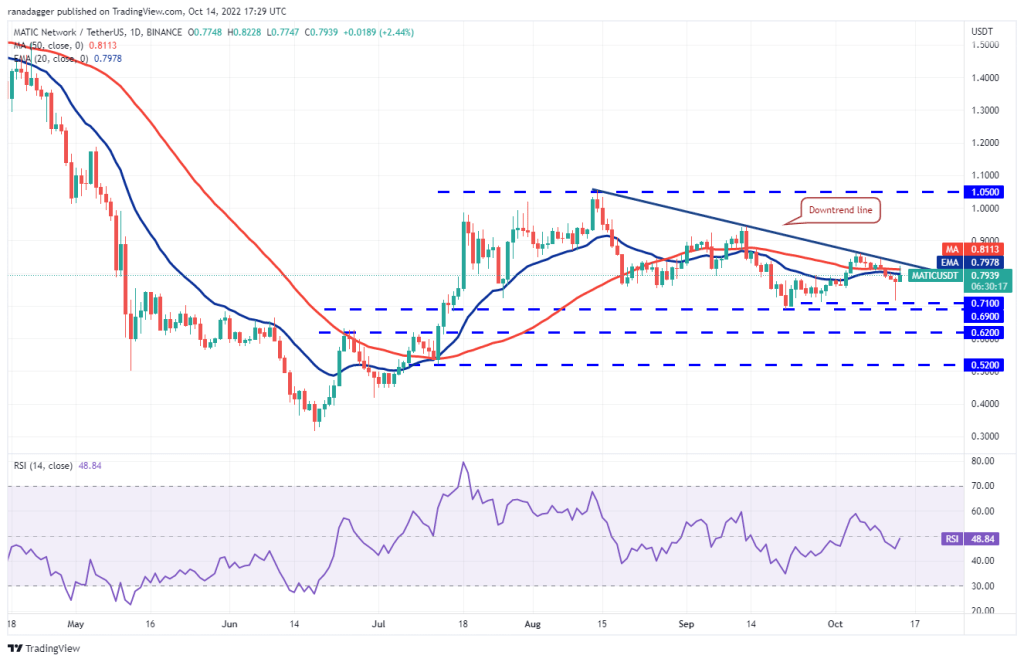
The long tail on Polygon’s October 13 candlestick indicates that the bulls are buying aggressively near the $0.71 to $0.69 support area. Buyers maintained their momentum on October 14 and tried to push the price above the downtrend line, but the bears held their ground. The horizontal moving averages and the RSI near the midpoint indicate a balance between supply and demand. If the price rises above the downtrend line, this balance may be in favor of the buyers. The MATIC/USDT pair can then rally to $0.86 and if this level is breached, the next stop could be at $0.94. On the downside, the $0.69 support level draws attention.
