
A few major altcoins continue to show weakness, including Bitcoin and DOGE. However, several data points are in favor of the bulls in the short term, according to crypto analyst Rakesh Upadhyay. From a macro perspective, it looks like it could be short-term weakness. But lower levels are likely to be bought. What are the important support levels to watch out for? The analyst examines the charts of the top 10 cryptocurrencies to find out.
An overview of the cryptocurrency market
Bitcoin has been trading between $25,333 and $26,156 since September 1. Typically, a volatility squeeze is followed by an expansion in volatility. However, it is difficult to precisely predict the direction of the breakout. CoinGlass data shows that Bitcoin fell six years in a row in September. This historical data could keep the bulls away in the near term and discourage the bears. Also, the US Dollar Index (DXY), which is inversely correlated with Bitcoin, has risen sharply over the past few weeks. Both cases likely suggest that Bitcoin will come under pressure in the short term.
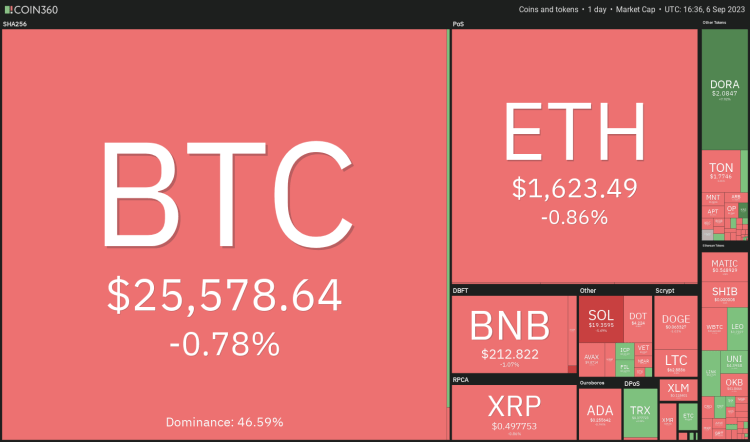 Daily cryptocurrency market performance. Source: Coin360
It’s not all gloom and doom for crypto bulls. Because lower levels are likely to attract buyers. The probability that one or more Bitcoin spot exchange-traded fund applications will be approved could limit the downward trend. cryptocoin.com As you follow, many analysts say that this event will be a big rise for Bitcoin. It is possible that any positive news on this subject will raise prices.
BTC, ETH, BNB, XRP and ADA analysis
Bitcoin (BTC) price analysis
Bitcoin has been trading below $26,000 for the past two days. Also, the bears are trying to pull the price towards the vital support at $24,800. The downward sloping moving averages point to the advantage of the sellers. However, the positive divergence in the relative strength index (RSI) indicates that the bearish momentum will weaken.
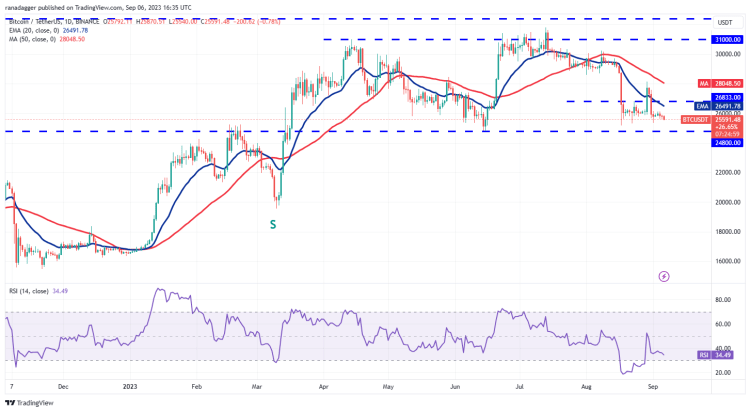
Buyers will need to push and sustain the price above $26,833 to start a relief rally towards the 50-day simple moving average (SMA) ($28,048). Such a move would indicate that the price is stuck in the wide range of $24,800 to $31,000. In the meantime, the bears are likely to have other plans. They will try to push the price below the $24,800-24,000 support zone. If they manage to do so, the sell-off could accelerate and BTC could drop to $20,000.
Ethereum (ETH) price analysis
The long tail on Ether’s September 4 and 5 candlestick indicates that the bulls are buying dips below the immediate support at $1,626. However, there is no trailing buy at higher levels. This means that the bears are selling on rallies around $1,650. This narrow range trading is unlikely to continue for long.
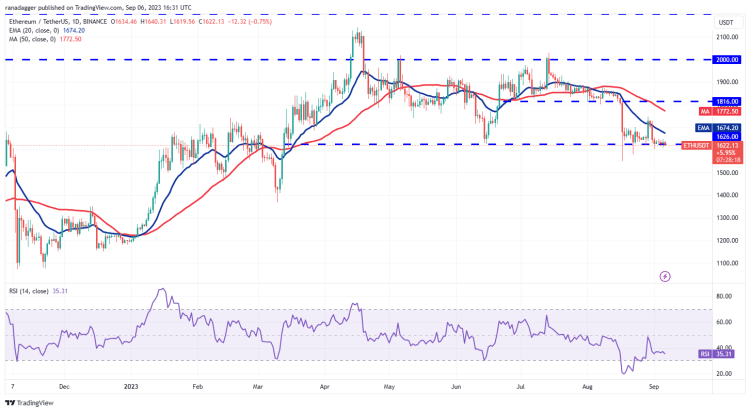
If the price declines and stays below $1,600, this will indicate that the bears are in control. There is a minor support at $1,550. However, if it breaks this support, it is possible for ETH to drop to $ 1,368. On the upside, the bears are likely to fiercely defend the zone between $1,650 and the 20-day exponential moving average (EMA) ($1,674). If buyers break this barrier, ETH is likely to rise to the 50-day SMA ($1,772).
Binance Coin (BNB) price analysis
BNB has been trading below the crucial level of $220 for the past few days. But the bears did not take advantage of this opportunity. This indicates that sales are declining at lower levels. This could cause BNB to be stuck between $220 and $200 for a while.
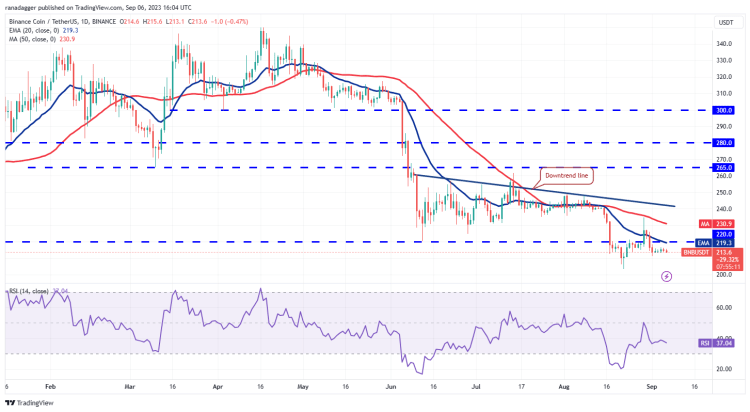
A tight consolidation below the breakdown level increases the likelihood of further declines. If it breaks the $200 support, it is possible for BNB to resume its downtrend. The next major support on the downside stands at $183. If buyers want to initiate a reversal, they will need to push the price above $220. This will indicate solid buying at the lower levels. It is possible for BNB to attempt a rally to the downtrend line later on.
Ripple (XRP) price analysis
XRP has been holding onto the $0.50 support for the past few days. Failure to initiate a strong rebound increases the likelihood of a downside breakout.
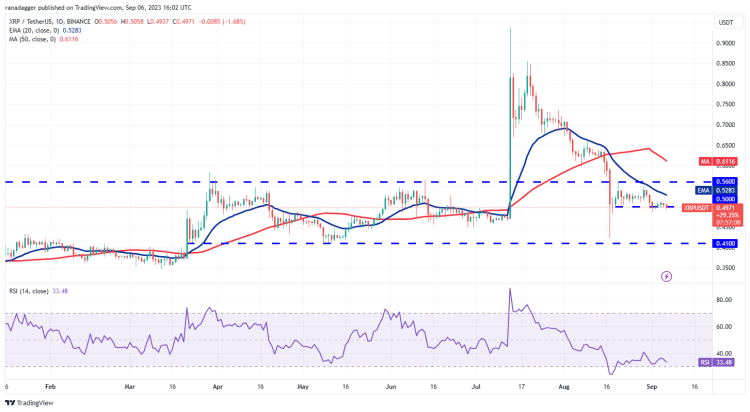
A break and close below $0.50 will indicate that XRP could extend its stay in the $0.56-$0.41 range for a few more days. There is no significant support between $0.50 and $0.41. This is why the decline is likely to be rapid. Another possibility is for the price to bounce back from the current level and break above the 20-day EMA ($0.52). If this happens, it is possible for XRP to rise to $0.56. This is an important level to consider.
Cardano (ADA) price analysis
Cardano’s ADA has been trading in a tight range for the past few days. This shows that the bulls and bears are playing it safe and not placing big bets.
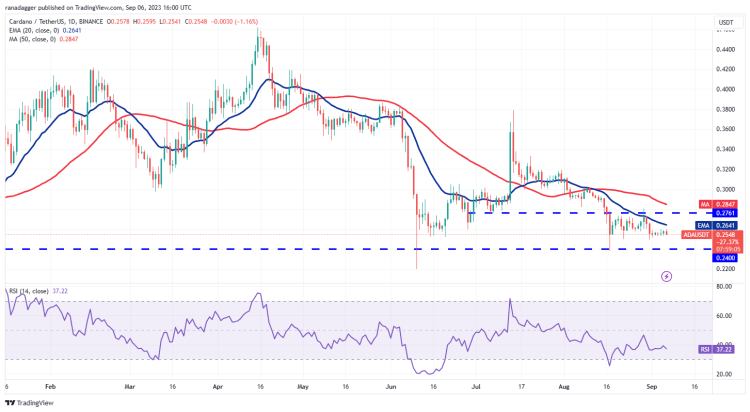
The downward sloping moving averages and the RSI in the negative zone suggest that the bears have a slight advantage. If the price drops below $0.25, the bears will attempt to push ADA down to $0.24. Conversely, a break and close above the 20-day EMA ($0.26) would be the first sign of strength. This will clear the way for a rise to the 50-day SMA ($0.28). Buyers will need to break through this hurdle to start a sustained recovery.
DOGE, SOL, TONE, DOT and MATIC analysis
Dogecoin (DOGE) price analysis
DOGE price reached the 20-day EMA ($0.06) on Sept. 6. This indicates that the bulls are trying to start a relief rally. However, bears are unlikely to give up easily. So, they will make a strong defense at the 20-day EMA.
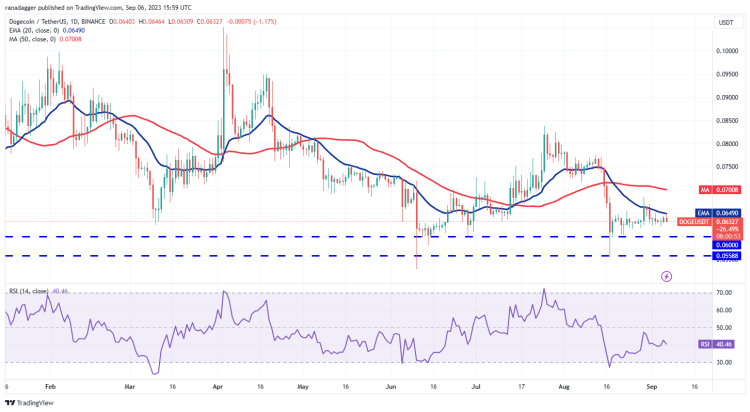
If DOGE falls sharply, the bears will try to strengthen their positions by pushing DOGE price below $0.06. If they are successful, it is possible for them to extend the DOGE decline to the next support at $0.055. On the upside, a break and close above the 20-day EMA will be the first sign that the selling pressure on the DOGE has subsided. It is possible that this could start a rally to the 50-day SMA ($0.07) and then to $0.08.
Solana (SOL) price analysis
The SOL recovery attempt faces a strong sell-off at the downtrend line. This shows that the bears are defending this level aggressively. If the price breaks below $19, it is possible for the SOL to continue the downtrend. On the downside, first support is at 18d, next at $16.
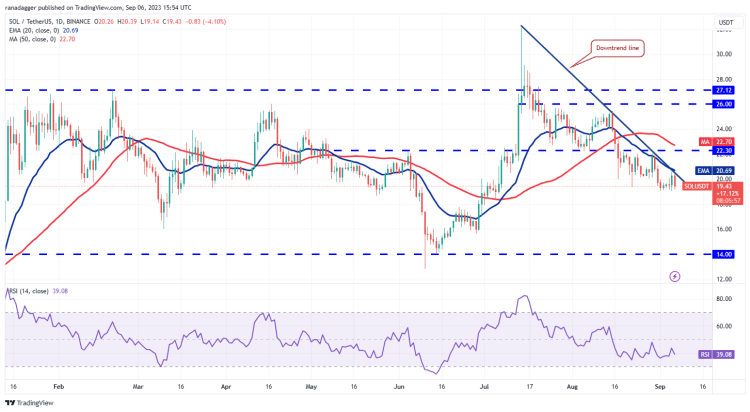
Expectations are for buyers to strongly defend this level. The first indicator of strength would be a break and close above the 20-day EMA ($20.69). It is possible that this could start a stronger recovery towards the 50-day SMA ($22.70). This level is likely to act as a barricade again. However, if the bulls clear this, SOL is likely to attempt a rise to $25.42.
Toncoin (TON) price analysis
The sharp rise in Toncoin (TON) pushed the RSI into the overbought territory, showing that the rally is getting ahead of itself. This typically leads to a correction or consolidation, and that’s what happens. The bears’ profit booking pushed the price towards the 20-day EMA ($1.64). This remains key support to watch out for.
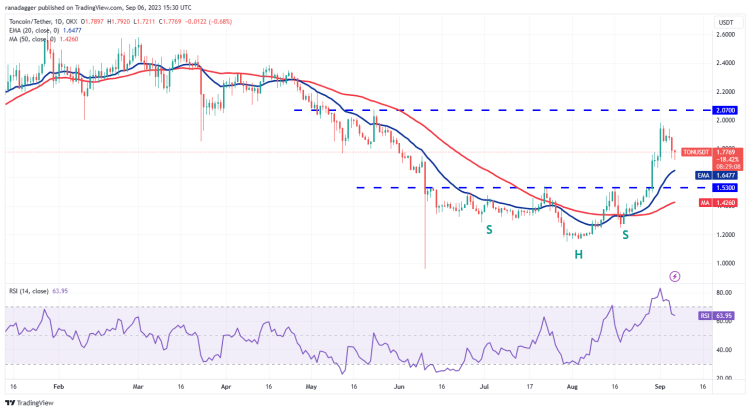
If the price bounces back from the 20-day EMA, it will indicate that the sentiment remains positive and traders are buying on the dips. It is possible that this will increase the price to $2.07. If this level gives way, the rally is likely to extend to $2.38. Alternatively, if the 20-day EMA cracks, it will indicate that the bulls are losing control. In this case, it is possible for the TON to decline to $1.53 and then to the 50-day SMA ($1.42).
Polkadot (DOT) price analysis
Buyers are struggling to initiate a strong recovery in DOT. This shows that the bears are continuing the pressure. The bearish moving averages and the RSI near the oversold zone increase the likelihood of a breakout to the downside.

If it surpasses the $4.22 level, it is possible for the DOT to slide to the next major support at $4. Contrary to this assumption, if the price turns up from the current level, the bears will try to stop the recovery at the 20-day EMA ($4.44) and again at the downtrend line. Buyers will need to break through this hurdle to indicate a potential trend change.
Polygon (MATIC) price analysis
Polygon’s MATIC hit the 20-day EMA ($0.57) on Sept. However, the bulls could not overcome this hurdle. This indicates that demand is drying up at higher levels. Now the bears will try to push the price towards the key $0.50 support. This remains the key level to watch out for in the near term. Because a break below will continue the downtrend.
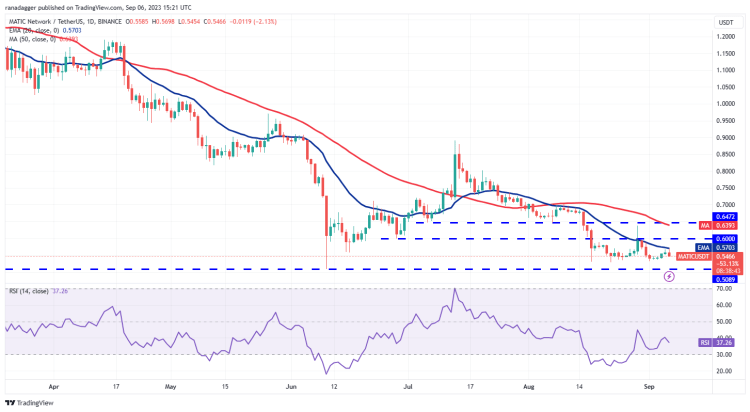
MATIC risks falling as low as $0.45 later. If the bulls want to avoid the downside, they will need to quickly push the price above the 20-day EMA. It is possible that this could start a stronger recovery to the overhead resistance of $0.60 and then $0.64. This level is likely to be the scene of hard selling by the bears again.