The cryptocurrency market has been on the rise after the CPI data were released. Top altcoin projects of the week outperform major cryptocurrencies! Here are those 10 altcoin projects…
These 10 altcoins are ahead of the market leaders!
Conflux (CFX)
Conflux is a blockchain project that enables projects to be built easily in Asia, with a focus on connecting decentralized economies to strengthen the global DeFi ecosystem. Its native token, CFX, surged 149 percent in seven days to a high of $0.400703. The last 24-hour transaction volume of the project exceeded $ 1.3 billion and attracted attention from many investors. Looking at the 4-hour chart, CFX is moving with the bulls as the 50 EMA is above the 200 EMA. Moreover, the 200 EMA and the 50 EMA almost intercepted each other, but CFX survived the death cross as the gap between the indicators continued to widen. This could indicate that CFX’s bullish journey will continue for a while.
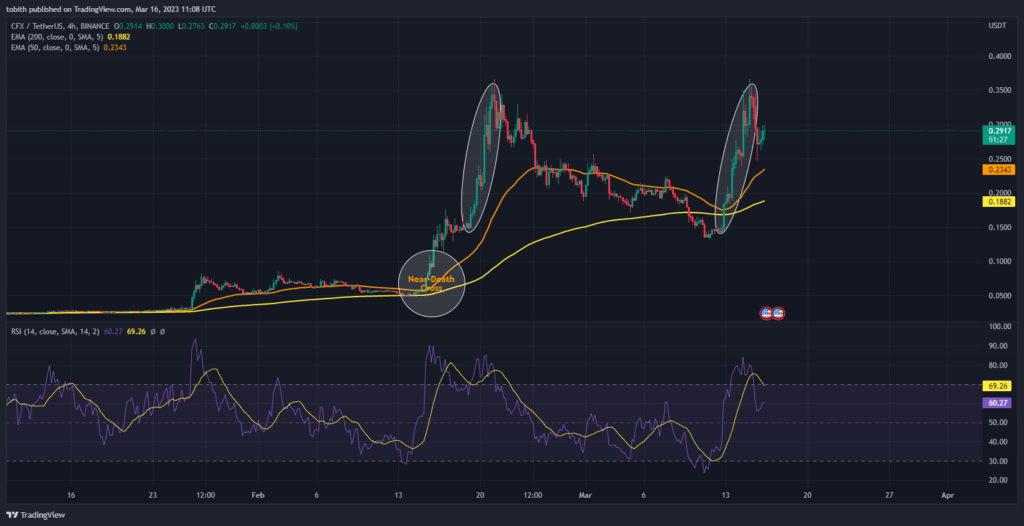
CFX’s movements are similar to the uptrend it witnessed at the end of February. February price action shows CFX moving close to the death cross before moving higher. The RSI (Relative Strength Index) stands at 60.13, which is considered neutral territory by some investors. However, when the RSI points up, there is a chance to move beyond its current position. If the RSI continues to the upside, it could rise above the SMA, confirming CFX’s bull run. Ultimately, traders should closely examine the indicators as they can confirm whether CFX will continue its bull run.
Stacks (STX)
As reported by Kriptokoin.com, Stacks (STX) is among the best coins of the week. STX has gained 100 percent over the week and is currently trading at $1.21. The 4-hour chart for STX with a market cap of $1.6 billion shows that the 50 EMA is above the 200 EMA and the bull run has begun. Moreover, the price has left the Support 2 zone in the dust and continues to widen the gap between the EMA indicators. If this gap continues to widen, there is a chance for STX to continue its upward trajectory with the possibility of moving beyond the Resistance 2 level.
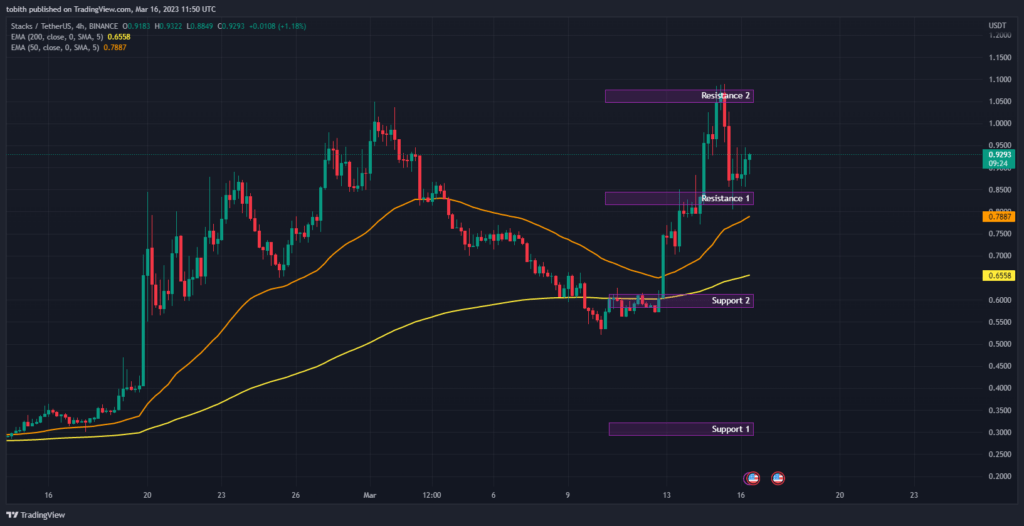
After the CPI data, some investors turned to STX. On the other hand, experts recommend that Traders observe indicators like ATR and RSI closely to understand price action and volatility.
SingularityNET (AGIX)
Following the GPT-4 version released by OpenAI this week, Singularity NET (AGIX) has been on the rise, gaining 57 percent over the week. Instantly, the project is trading at $0.526173. Its market value is $634 million. On the other hand, looking at the 4-hour chart, AGIX performed remarkably after making a comeback from death cross.
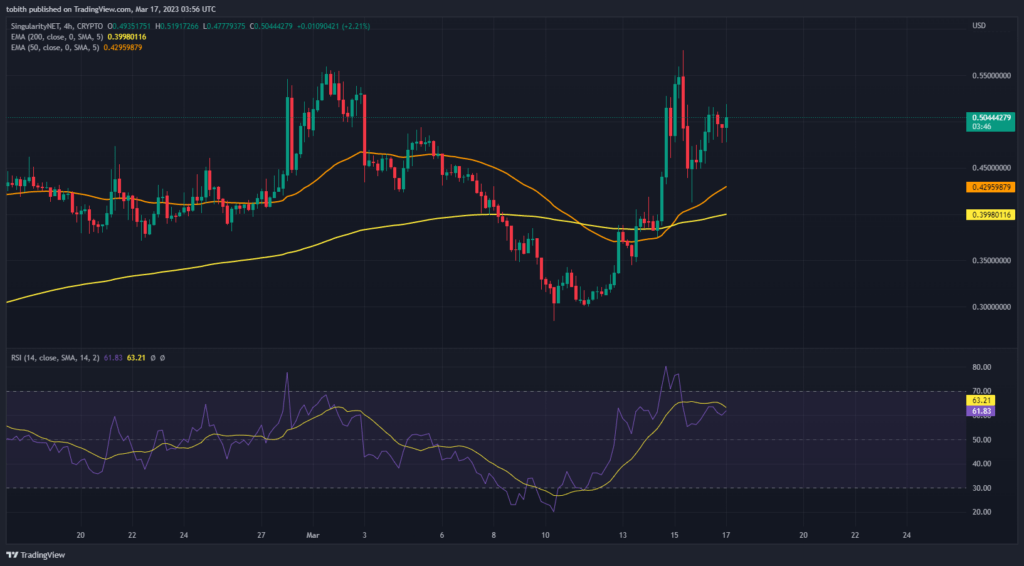
The BBP (Bull-Bearish balance) indicator with a value of 0.03144 also states that AGIX is currently under the power of the bull. Also, BBP is pointing upwards, which may indicate that AGIX may rise sooner. Although the RSI (Relative Strength Index) is at 61.76, it is below the SMA, which is considered a sign that the bears may pull the price down. However, looking at the trajectory of the RSI, it may cross the SMA. This could confirm that AGIX will go higher as buyers show demand. Investors should study the indicators closely before buying AGIX as there may be a chance for price reversal soon.
Kava (KAVA)
KAVA was among the top performing coins this week. KAVA gained more than 11 percent in the seven-day period. Its price is momentarily at the level of $ 1.02. Its market value is at the level of 455 million dollars.
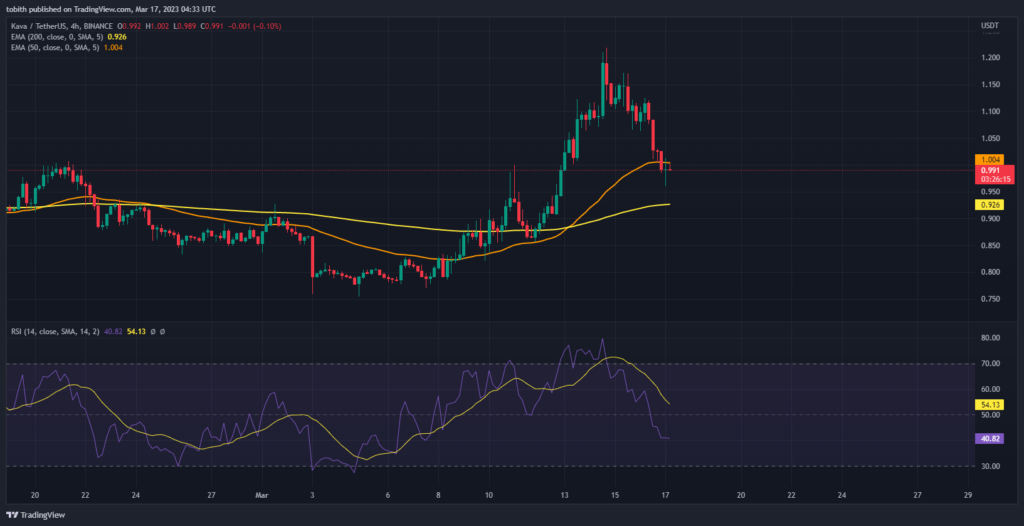
Looking at the 4-hour chart, KAVA is climbing upwards. However, KAVA is currently trading below the 50 EMA which can be considered a sign that KAVA will start to retrace from its bullish climb. Also, the RSI is currently at 42.09, which is considered neutral territory by many traders. Experts state that there may be a market correction and that KAVA may rise again.
ImmutableX (IMX)
Immutable X (IMX) gained 77 percent in a seven-day period. Instantly, the project is trading at $1.50 and has a market cap of $1.3 billion. Experts point out that the demand for the project may decrease in the near future due to the depreciation of the transaction volume.
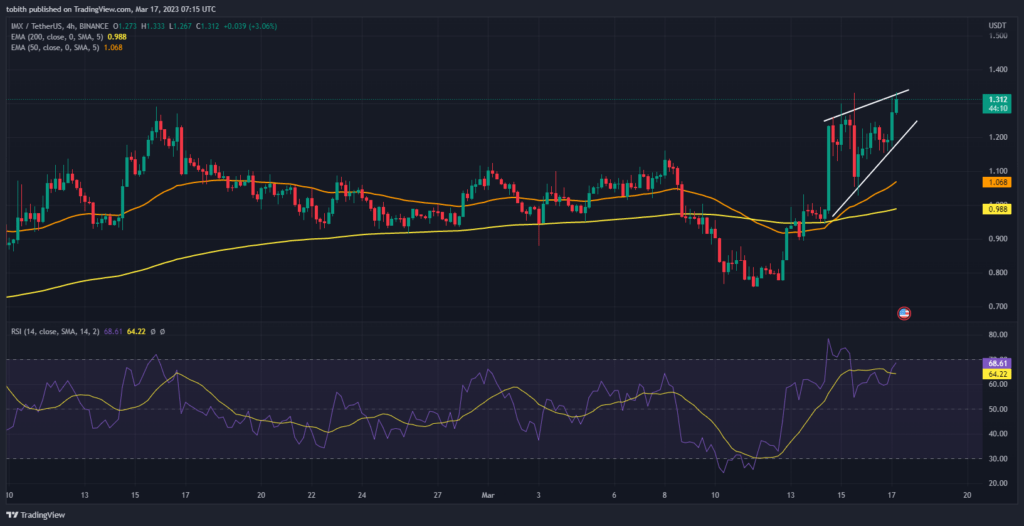
According to the chart, IMX is forming an ascending wedge pattern, which is a signal that IMX may fall. Experts point to close monitoring of price action. The RSI, on the other hand, is currently above the SMA and is pointing up, indicating that the price will continue to rise. However, the RSI is at 68.55 and it continues its journey towards the overbought territory. Once IMX reaches the overbought territory, traders can expect IMX to face a price correction.
Render Token (RNDR)
RNDR, which is among the top coins of the week, performed well throughout the week. The coin is instantly trading at $1.52 and has gained 43 percent in 7 days. The coin, with a market value of 548 million, had a spectacular breakout last Sunday. Even though the 50 EMA was below the 200EMA, the buyers joined the defense of the RNDR by raising their prices. From Sunday, the gap between the 200EMA and the 50EMA started to narrow, indicating a possible golden cross soon.
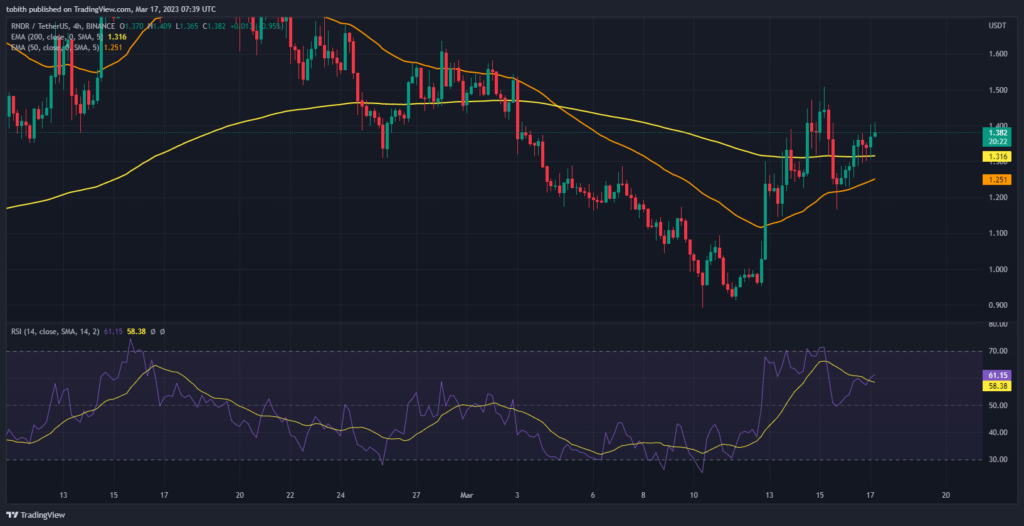
RSI recently crossed the SMA upwards at 61.15. This is a sign that the price may continue to rise until it reaches the overbought zone. Once the altcoin reaches the RNDR overbought zone, traders will sell the AI coin. However, price correction can wait.
GMX (GMX)
GMX gained 28 percent in seven days. It is currently trading at $81.78. With a market cap of $698 million, the coin has proven its worth by surviving a major drop.
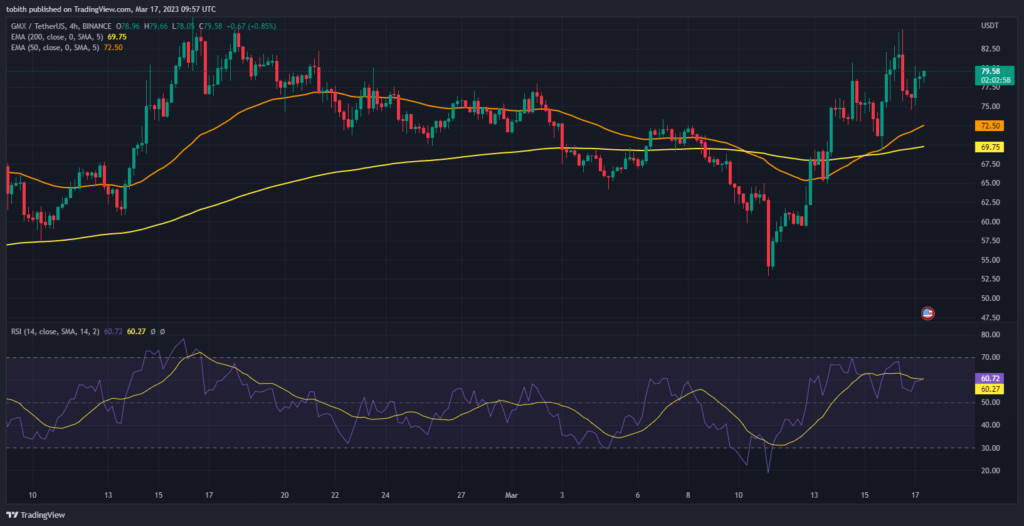
The coin, which was traded at $ 54 last Saturday, rose to $ 76 on Thursday. Altcoin GMX’s trajectory is currently aimed upwards as the price rises. Also on Tuesday, the 200 EMA and 50 EMA formed the golden cross, marking the start of the bull run. Also, the RSI stands at 60.72, which is considered neutral territory by some traders. The RSI momentarily touches the vital area SMA as the trajectory for GMX is not clear yet.
Cosmos (ATOM)
Cosmos (ATOM) has been one of the coins that has been on the rise during the week. ATOM is currently trading at $12.61 and has a market cap of $3.6 billion. The coin gained 13 percent over the week.
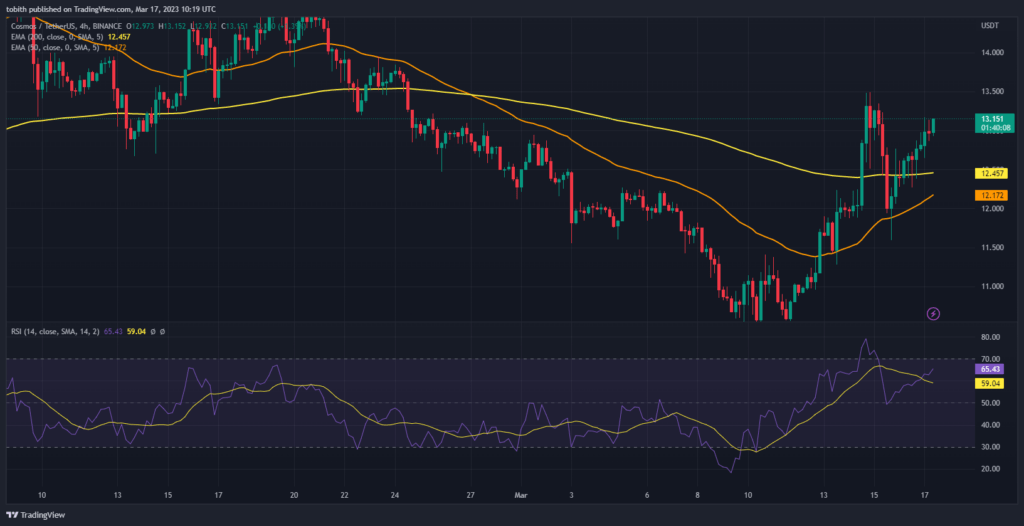
However, the 50EMA is below the 200 EMA, which is considered a bearish sign. While focusing on the price action of altcoin ATOM, it is currently still going up and the gap between the 50 EMA and 200 EMA continues to narrow, indicating that the golden cross is imminent. The RSI also confirms that a golden cross could form as its trajectory is pointing upwards. Moreover, the RSI has crossed the path of the SMA and continues to rise as it approaches the overbought zone. Currently, the RSI is at 65.39 and may soon cross the 70 margin. After crossing the overbought zone, the price of ATOM may soon face a correction.
Fetch.ai (FET)
Another altcoin that started to rise with the launch of GPT-4 appeared as FET. The project gained 47 percent in value in seven days. It is currently priced at $0.44. Its market value is over $360 million.
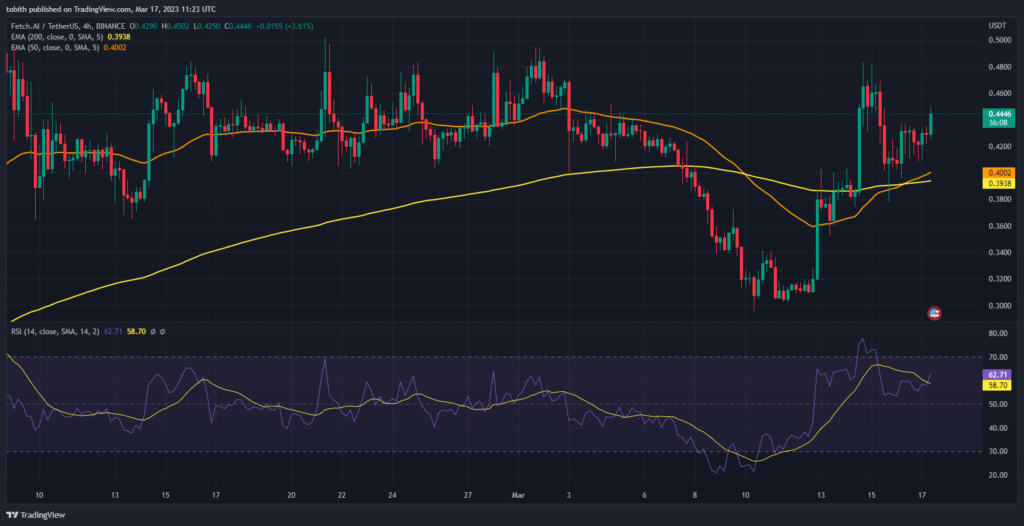
The 4-hour chart reveals that FET price has made a big jump twice, on Sunday and Tuesday. During the week, FET got rid of the bears thanks to the golden cross that marked the start of the bull run. The golden cross signals that the FET will continue to move up for a while. Also, the RSI is at 62.49 and it is approaching the overbought zone as the indicator is pointing up. The RSI also crossed the SMA confirming that the FET may remain in a bull run for a while. But as soon as it gets to the overbought region, the FET can go down gradually.
Tezos (XTZ)
Tezos is among the top coins of the week with a surprising price action. Like many altcoins, XTZ saw a huge spike on Tuesday. XTZ has gained 26 percent in seven days. It is currently trading at $1.23. Its market value is $1.14 billion.
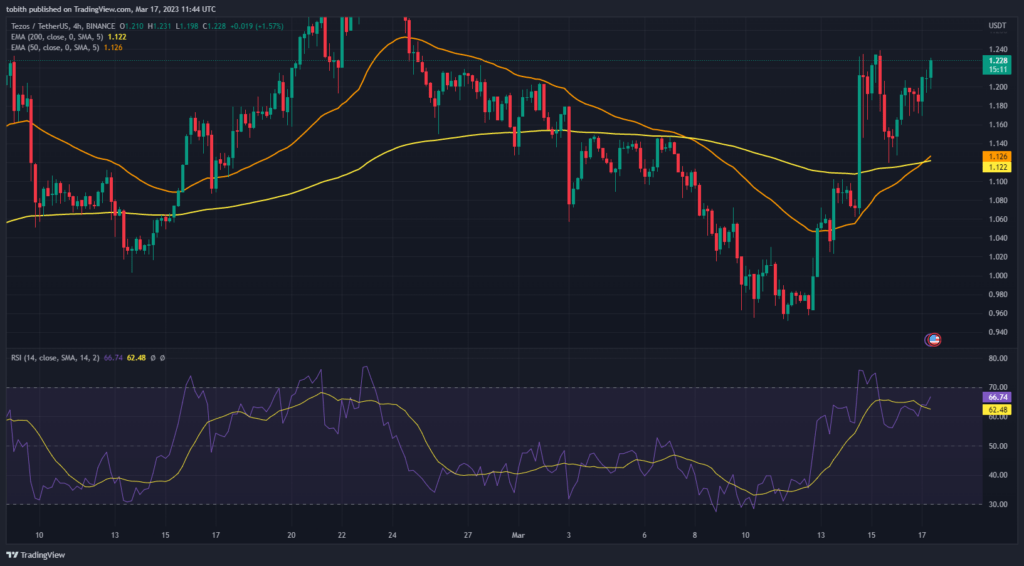
Looking at the 4-hour charts, XTZ recently formed a golden cross as the price continues to rise. With the formation of the golden cross, XTZ will continue to lead the bulls and traders can expect prices to increase further. RSI confirms this prediction as its trajectory is facing upwards. Also, the RSI is above the SMA, indicating that it will soon move into the overbought territory.

