Ether (ETH) is facing selling pressure ahead of the U.S. inflation report that could offer clues on whether the Federal Reserve has the room to slow liquidity tightening.
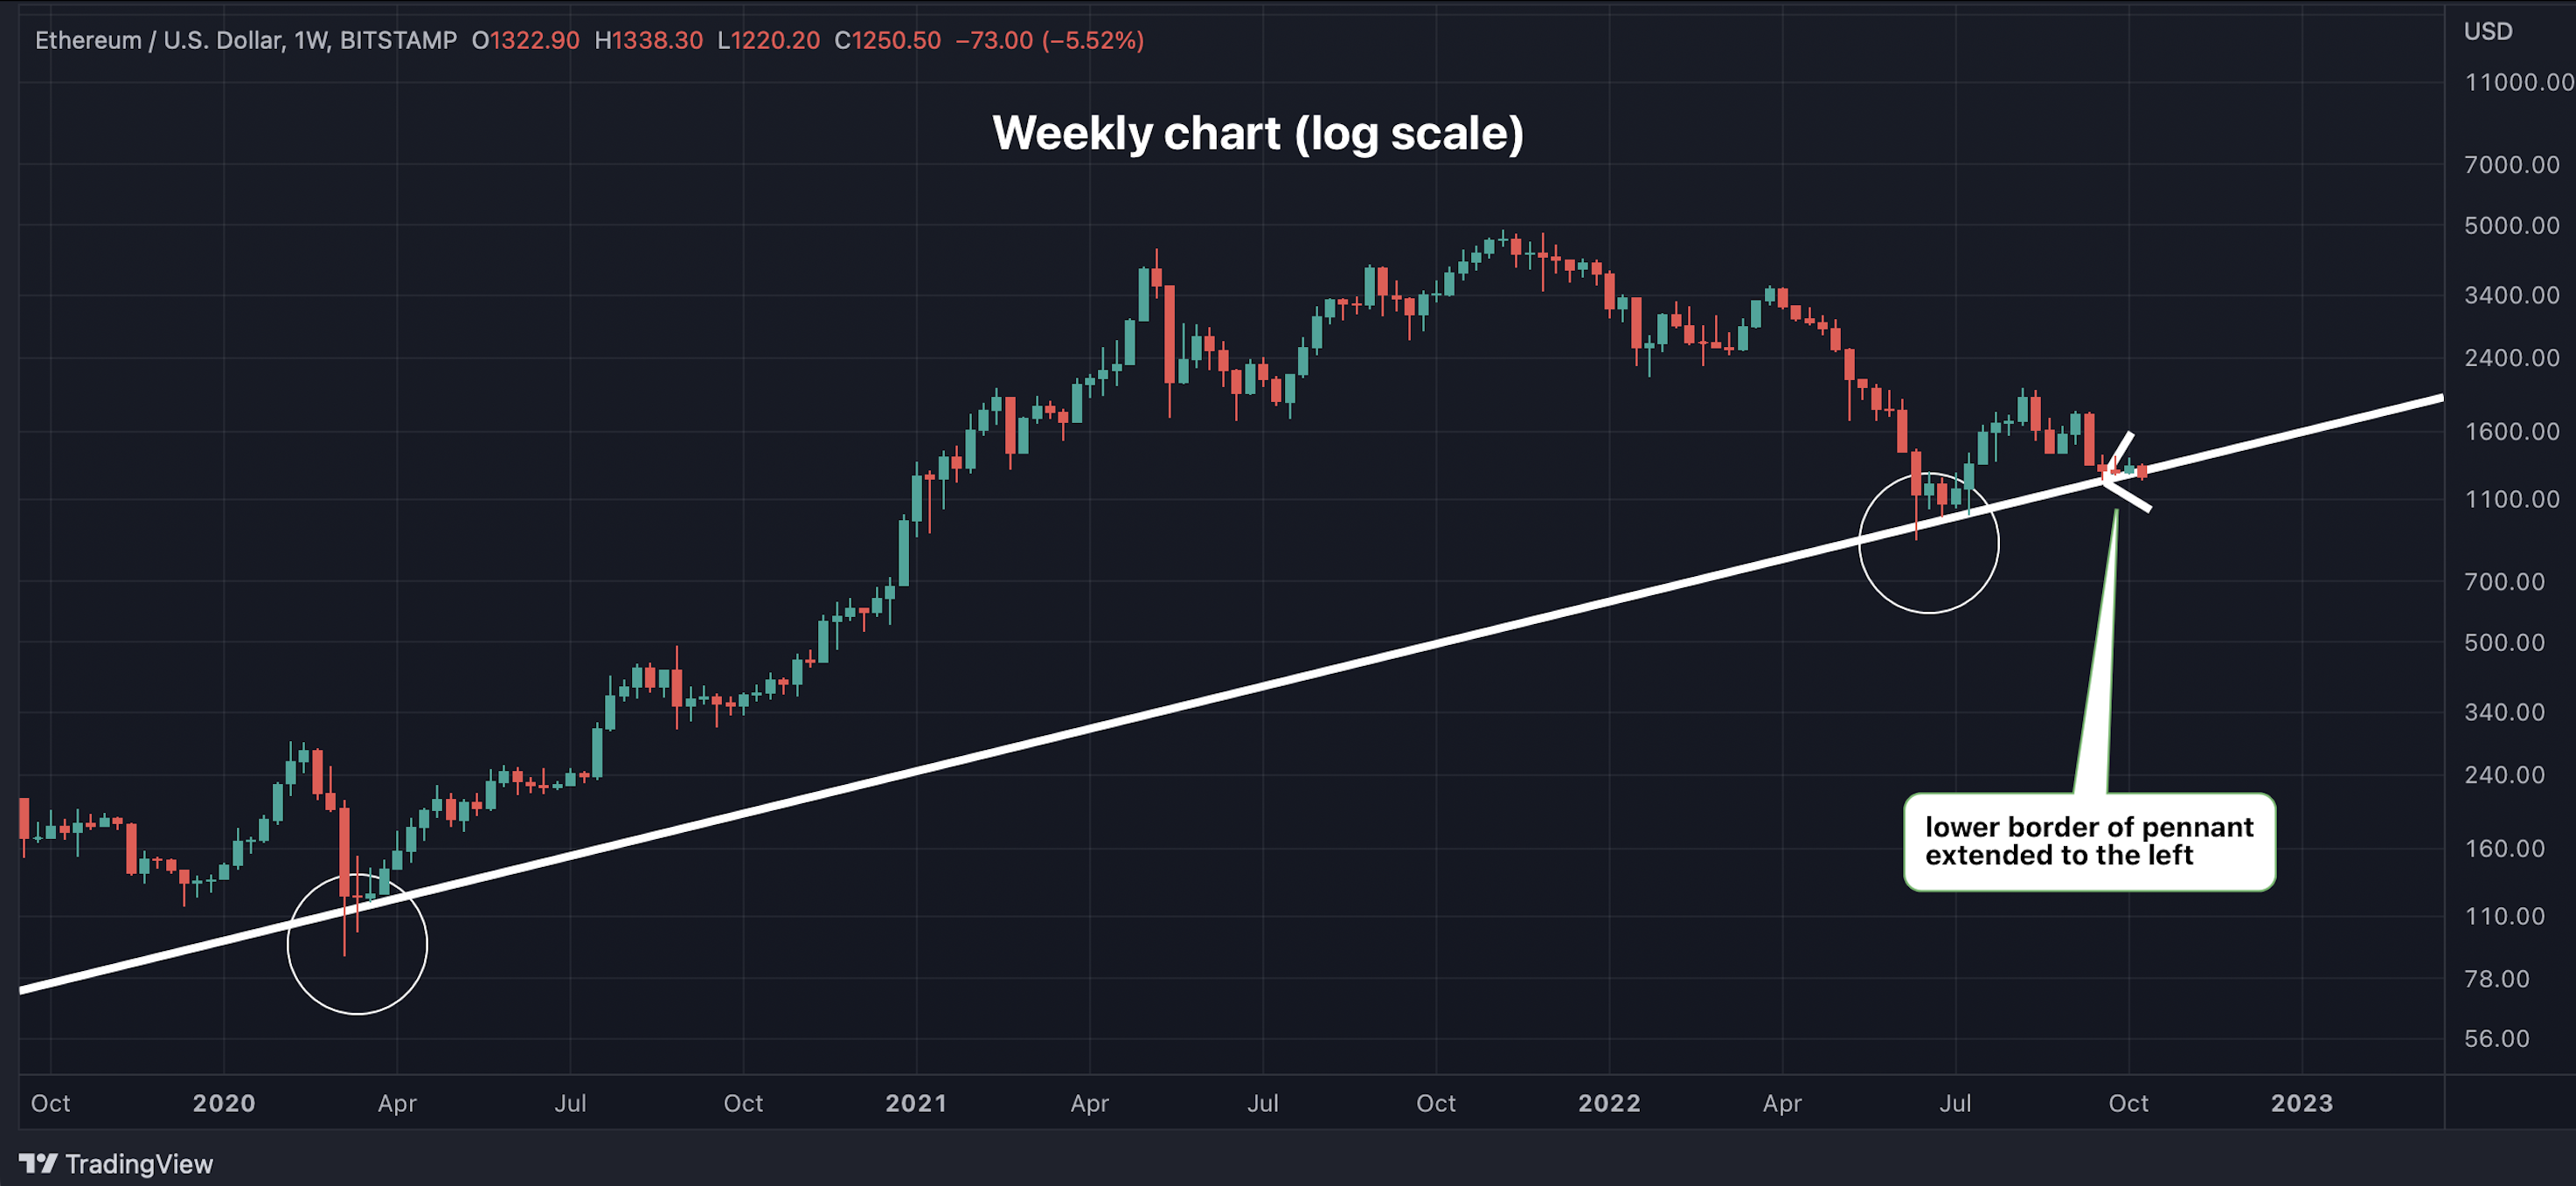
Ethereum’s native token dropped 4% to $1,220 on Thursday, exiting a three-week-long triangular consolidation pattern called pennant, as the feature image sourced from TradingView shows.
The so-called pennant breakdown has bearish implications, according to Goncola Moreira, a chartered market technician.Pennants represent brief consolidation after a notable rally or decline and usually pave the way for a continuation of the preceding trend.
Ether’s pennant breakdown has opened the doors for deeper decline and the bears may capitalize on the same if the U.S. consumer price index (CPI) comes in hotter than expected.
However, according to Moreira, the ensuring sell-off may be short-lived, with bargain hunters taking advantage of cheaper valuations.
“The good thing is that ether is nearing buyers’ territory,” Moreira told CoinDesk. “If we extend the lower border of the pennant pattern to the left on a log-scale weekly chart, the extended trendline corresponds with the June low and the March 2020 low.”
The lower border of the pennant is represented by a trendline connecting the Sept. 21 and Oct 3 lows.

Ether is nearing buyers’ territory. (TradingView) (TradingView)
A logarithmic scale chart plots values between two points according to the percent change rather than the absolute change and is suitable for data with vast value disparity. For instance, ether has gone from being valued in two digits in March 2020 to four digits at press time. Technical analysts often use log charts to analyze long-term trends.
The pennant breakdown would become irrelevant if the U.S. data shows inflation cooled notably in September. That might revive the Fed pivot hopes, bringing relief to risk assets, including cryptocurrencies.
The Labor Department will release the CPI data at 12:30 UTC.


