Market Anticipation: Trump’s Tariff Announcement

Wednesday could mark a significant turning point for financial markets, including the realm of cryptocurrencies. President Donald Trump is anticipated to unveil comprehensive reciprocal tariffs aimed at “liberating” the United States from what he deems unfair trading practices by its partners. As the market braces for this crucial announcement, signs of exhaustion in the downward trend of ether (ETH) have begun to surface. After lagging behind Bitcoin (BTC) for an extended period during the recent bull run, ETH might take center stage if the forthcoming tariffs turn out to be more measured than many expect.

Seller Fatigue at March Lows: A Potential Double Bottom
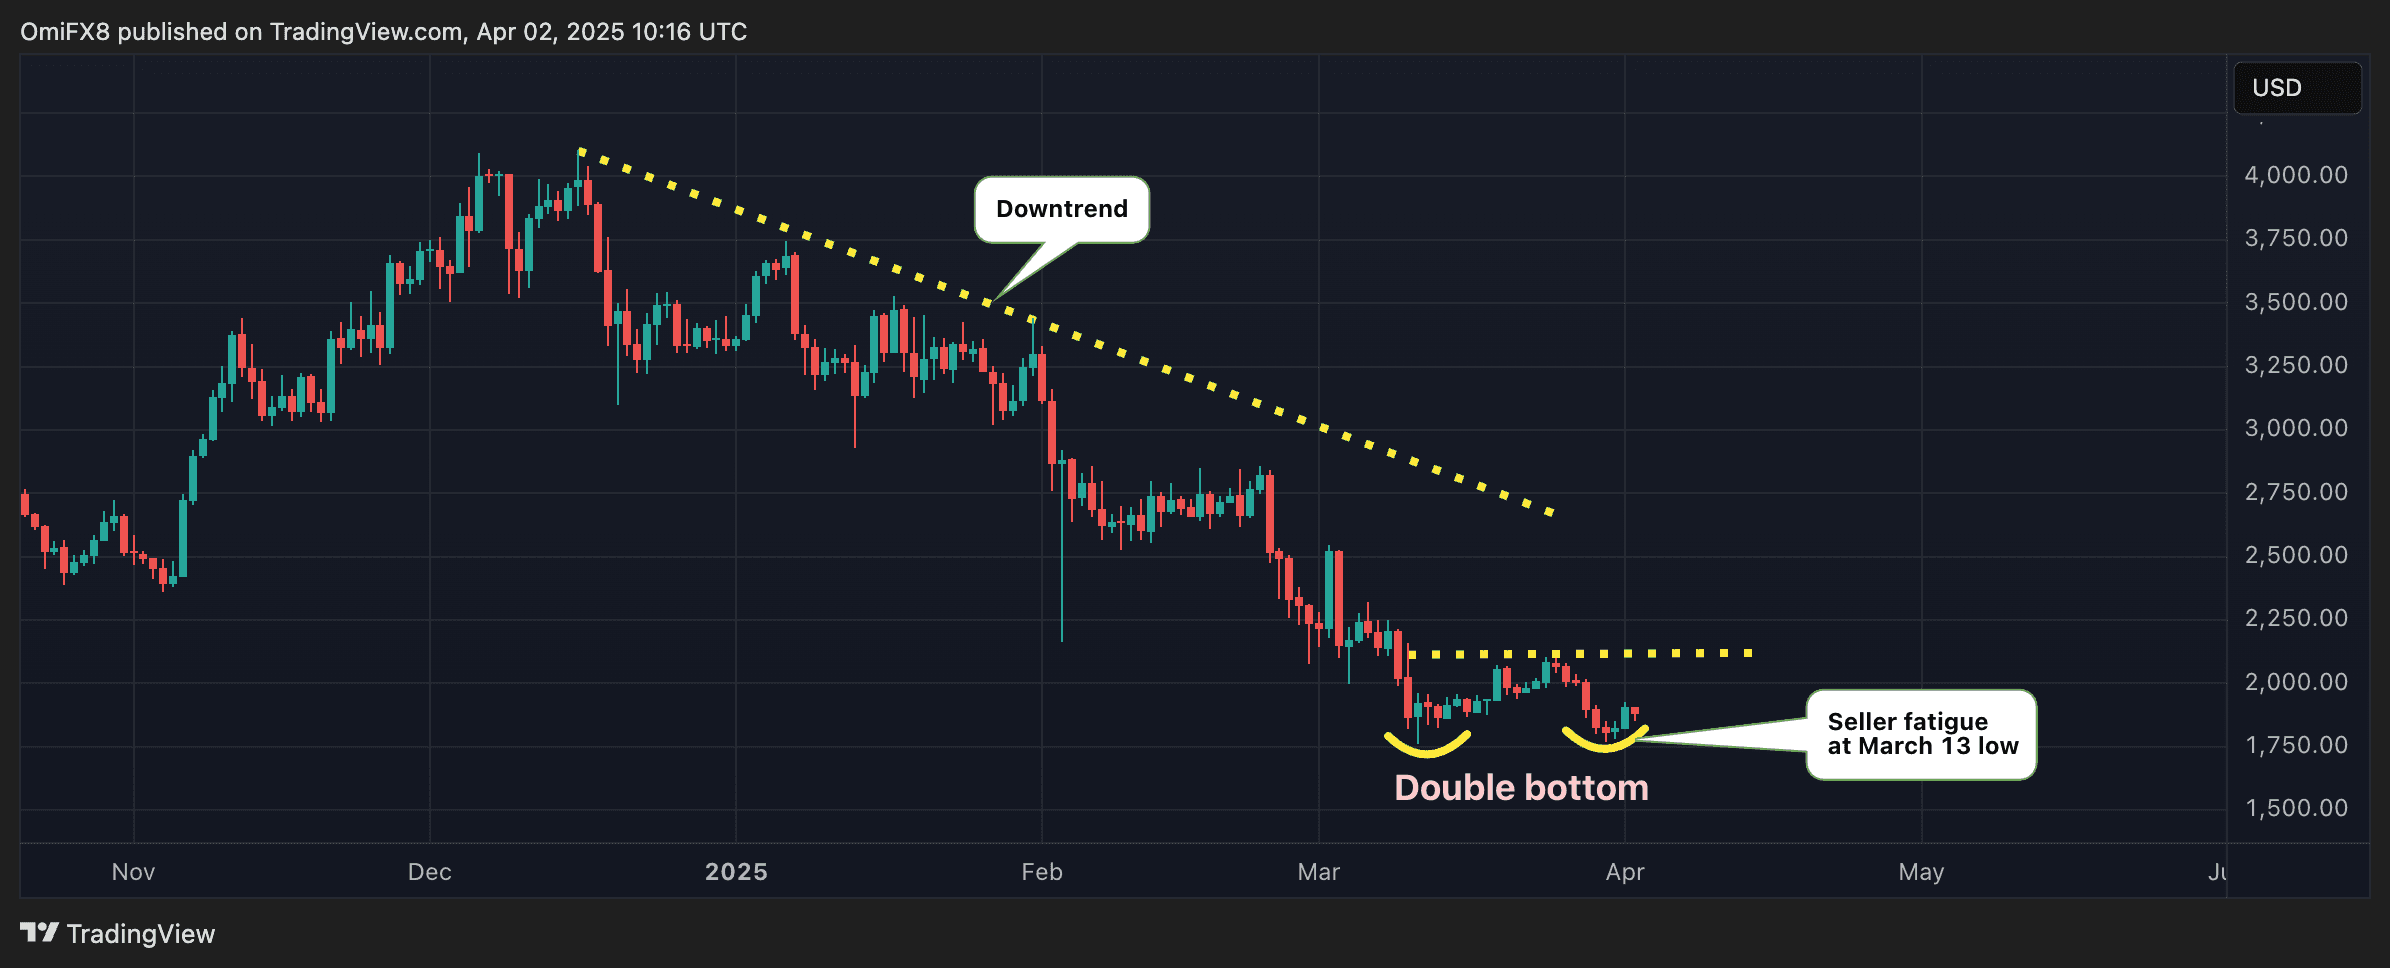
Last week, ether experienced a decline similar to Bitcoin; however, the bears were unable to breach the 16-month low of $1,755 established on March 11. This inability to break below the March lows serves as an initial indicator of seller fatigue or downtrend exhaustion. Following this, prices have rebounded to $1,880, hinting at a potential double bottom formation, with the resistance neckline positioned at $2,104. A breakthrough above this level would confirm a bullish breakout, paving the way toward the next resistance level at $2,400, as determined by the measured move technique.

ETH’s Daily Chart Analysis
As illustrated in the ETH daily chart, we can observe the intricate movements of the market. The potential double bottom formation suggests a shift in momentum that traders should carefully monitor.
Bullish Divergence: Signs of Strength
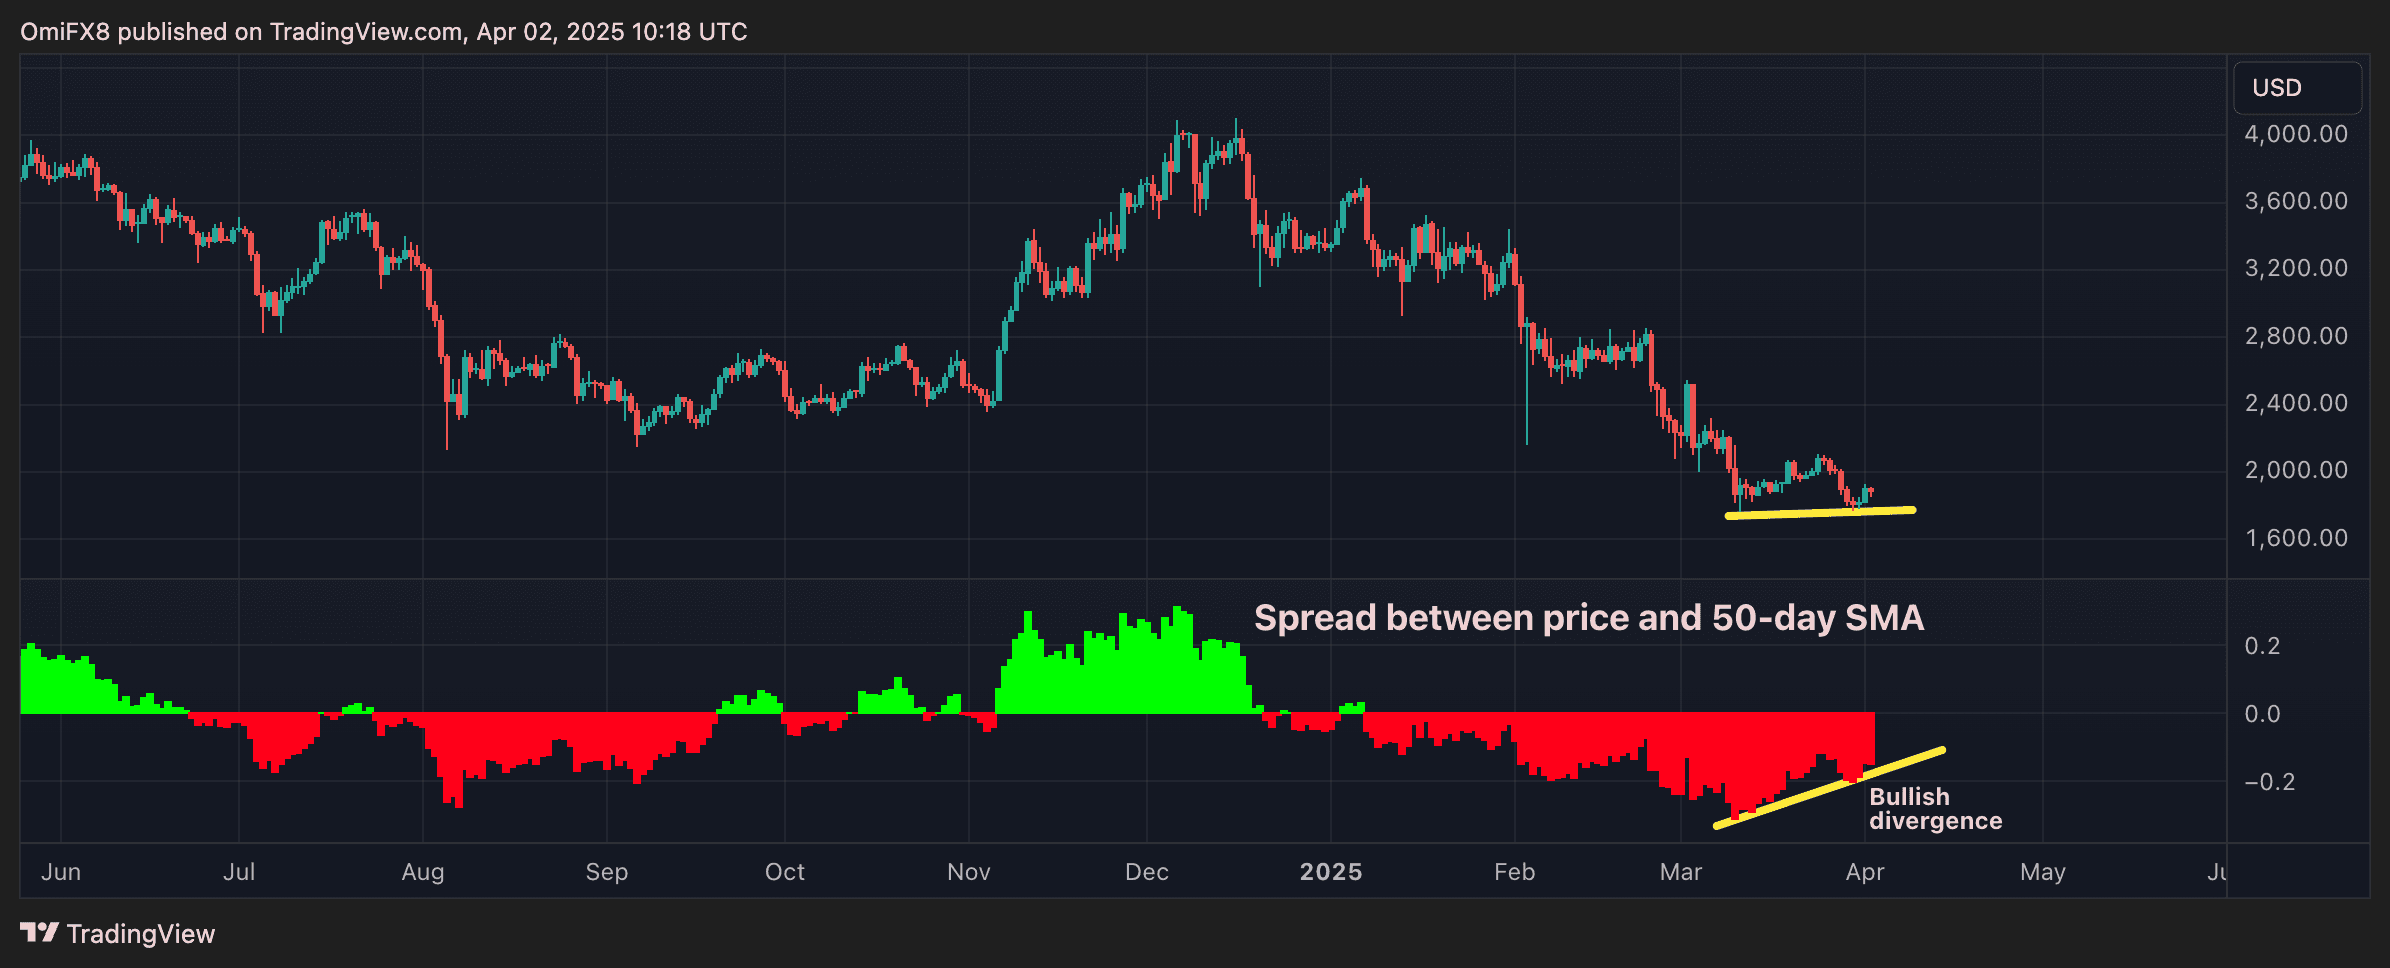
Despite the price revisiting the March 11 low last week, the histogram representing the difference between the price and its 50-day simple moving average (SMA) did not follow suit, instead carving out a higher low. This divergence indicates that although prices have fallen, the momentum driving this downward movement is weakening, hinting at a potential shift toward recovery.
Line Break Chart: A Bullish Flip
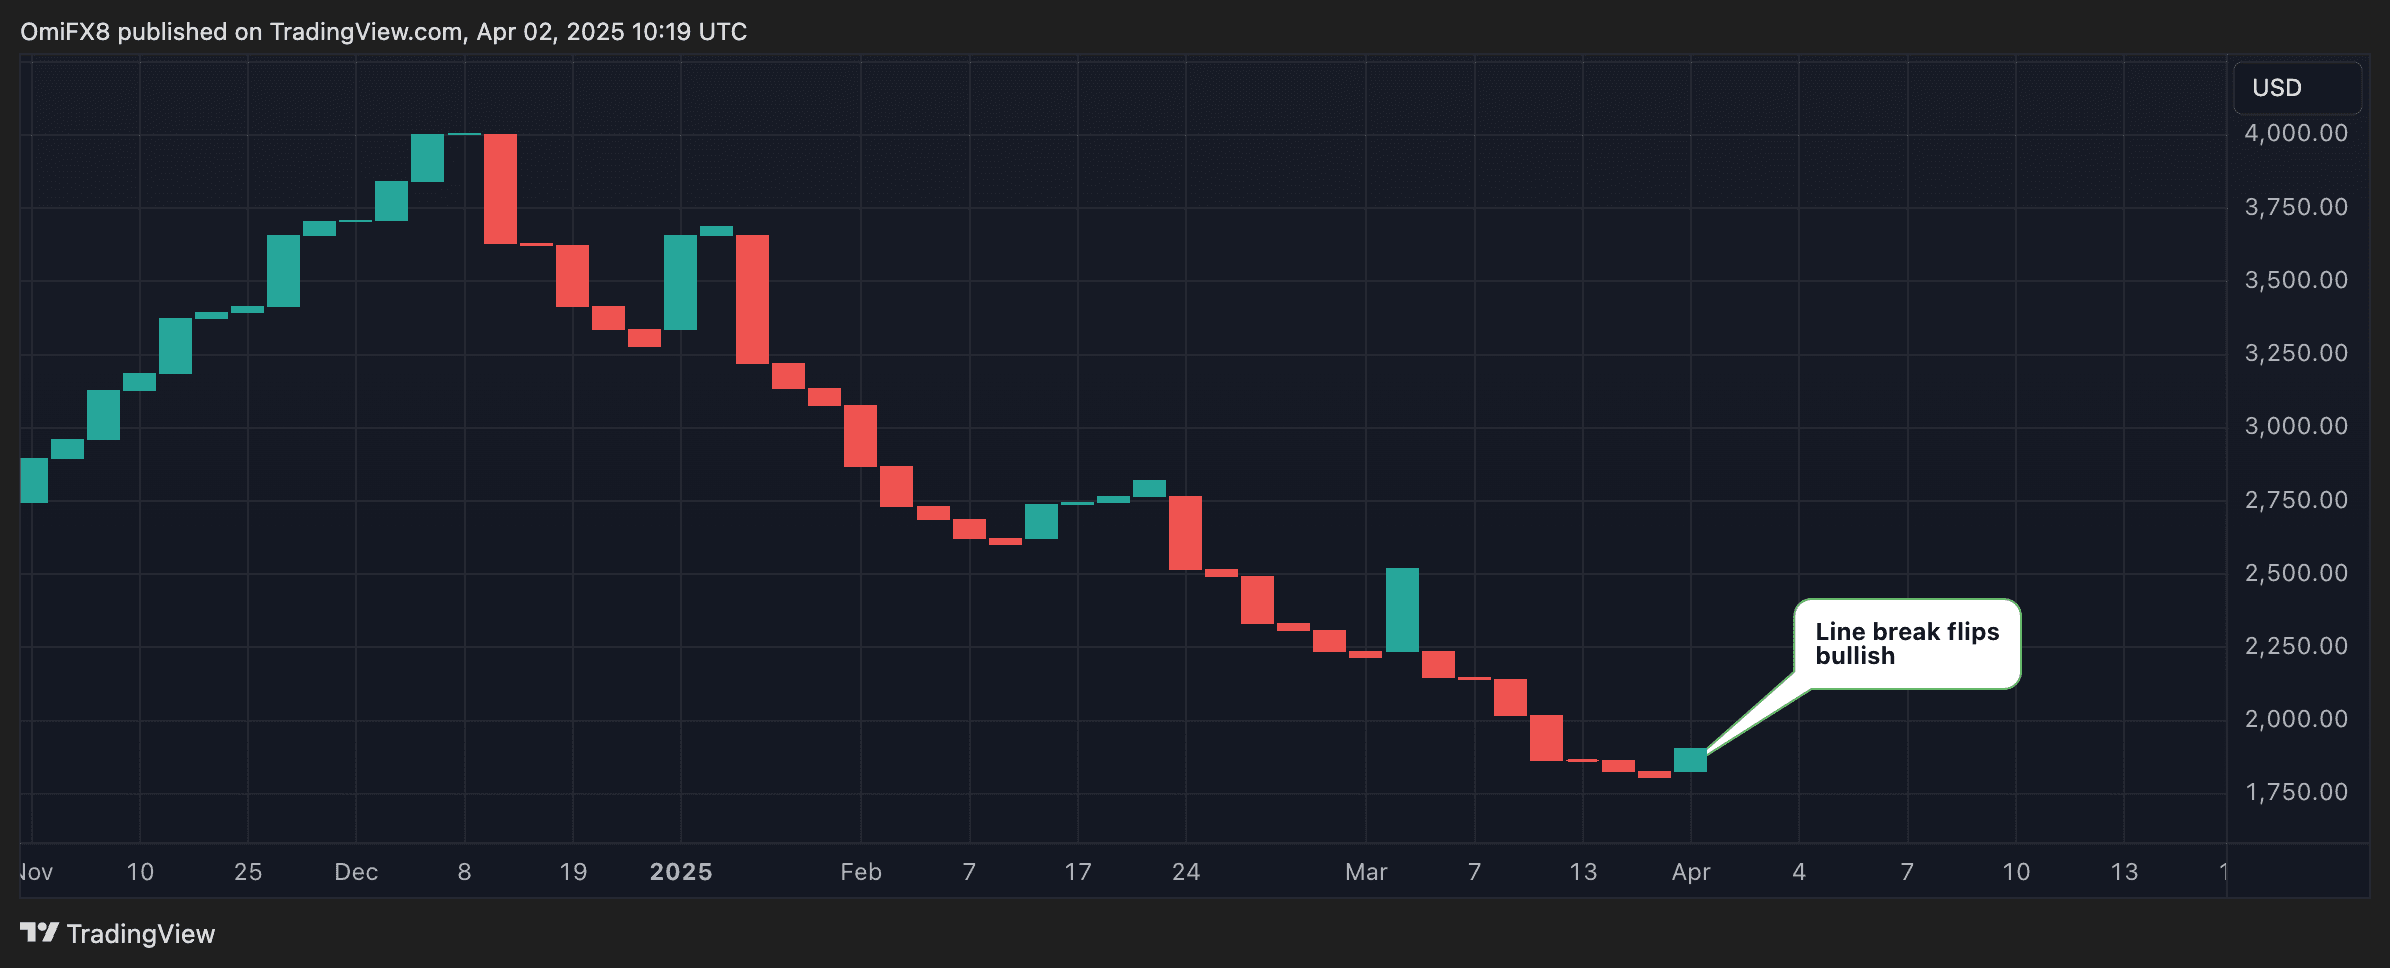
After a prolonged downtrend that witnessed prices halving to $2,000, the three-line break chart has now exhibited a bullish flip, signaling a notable shift in market sentiment. This transformation is visually represented by the emergence of a green bar on the daily timeframe, suggesting a possible reversal in price momentum.
ETH’s Three-Line Break Chart
Although the previous bullish signal from early March proved to be short-lived and turned out to be a bear trap, the latest bullish signal appears to be more reliable. This is bolstered by the indications of downtrend exhaustion observed in the candlestick charts discussed earlier. However, it is crucial to note that macroeconomic factors can significantly influence market dynamics. Thus, widespread risk aversion triggered by Trump’s tariffs could potentially invalidate all the bullish signals outlined above, leading to deeper losses in ether.


