XRP’s long -term investors began to accumulate again after a wave of snow. This movement can actually be evaluated as the rise will begin. However, according to experienced technical analyst Yashu Gala, history shows that this usually comes before XRP corrections.
Has the XRP Coin already reached the summit in 2025?
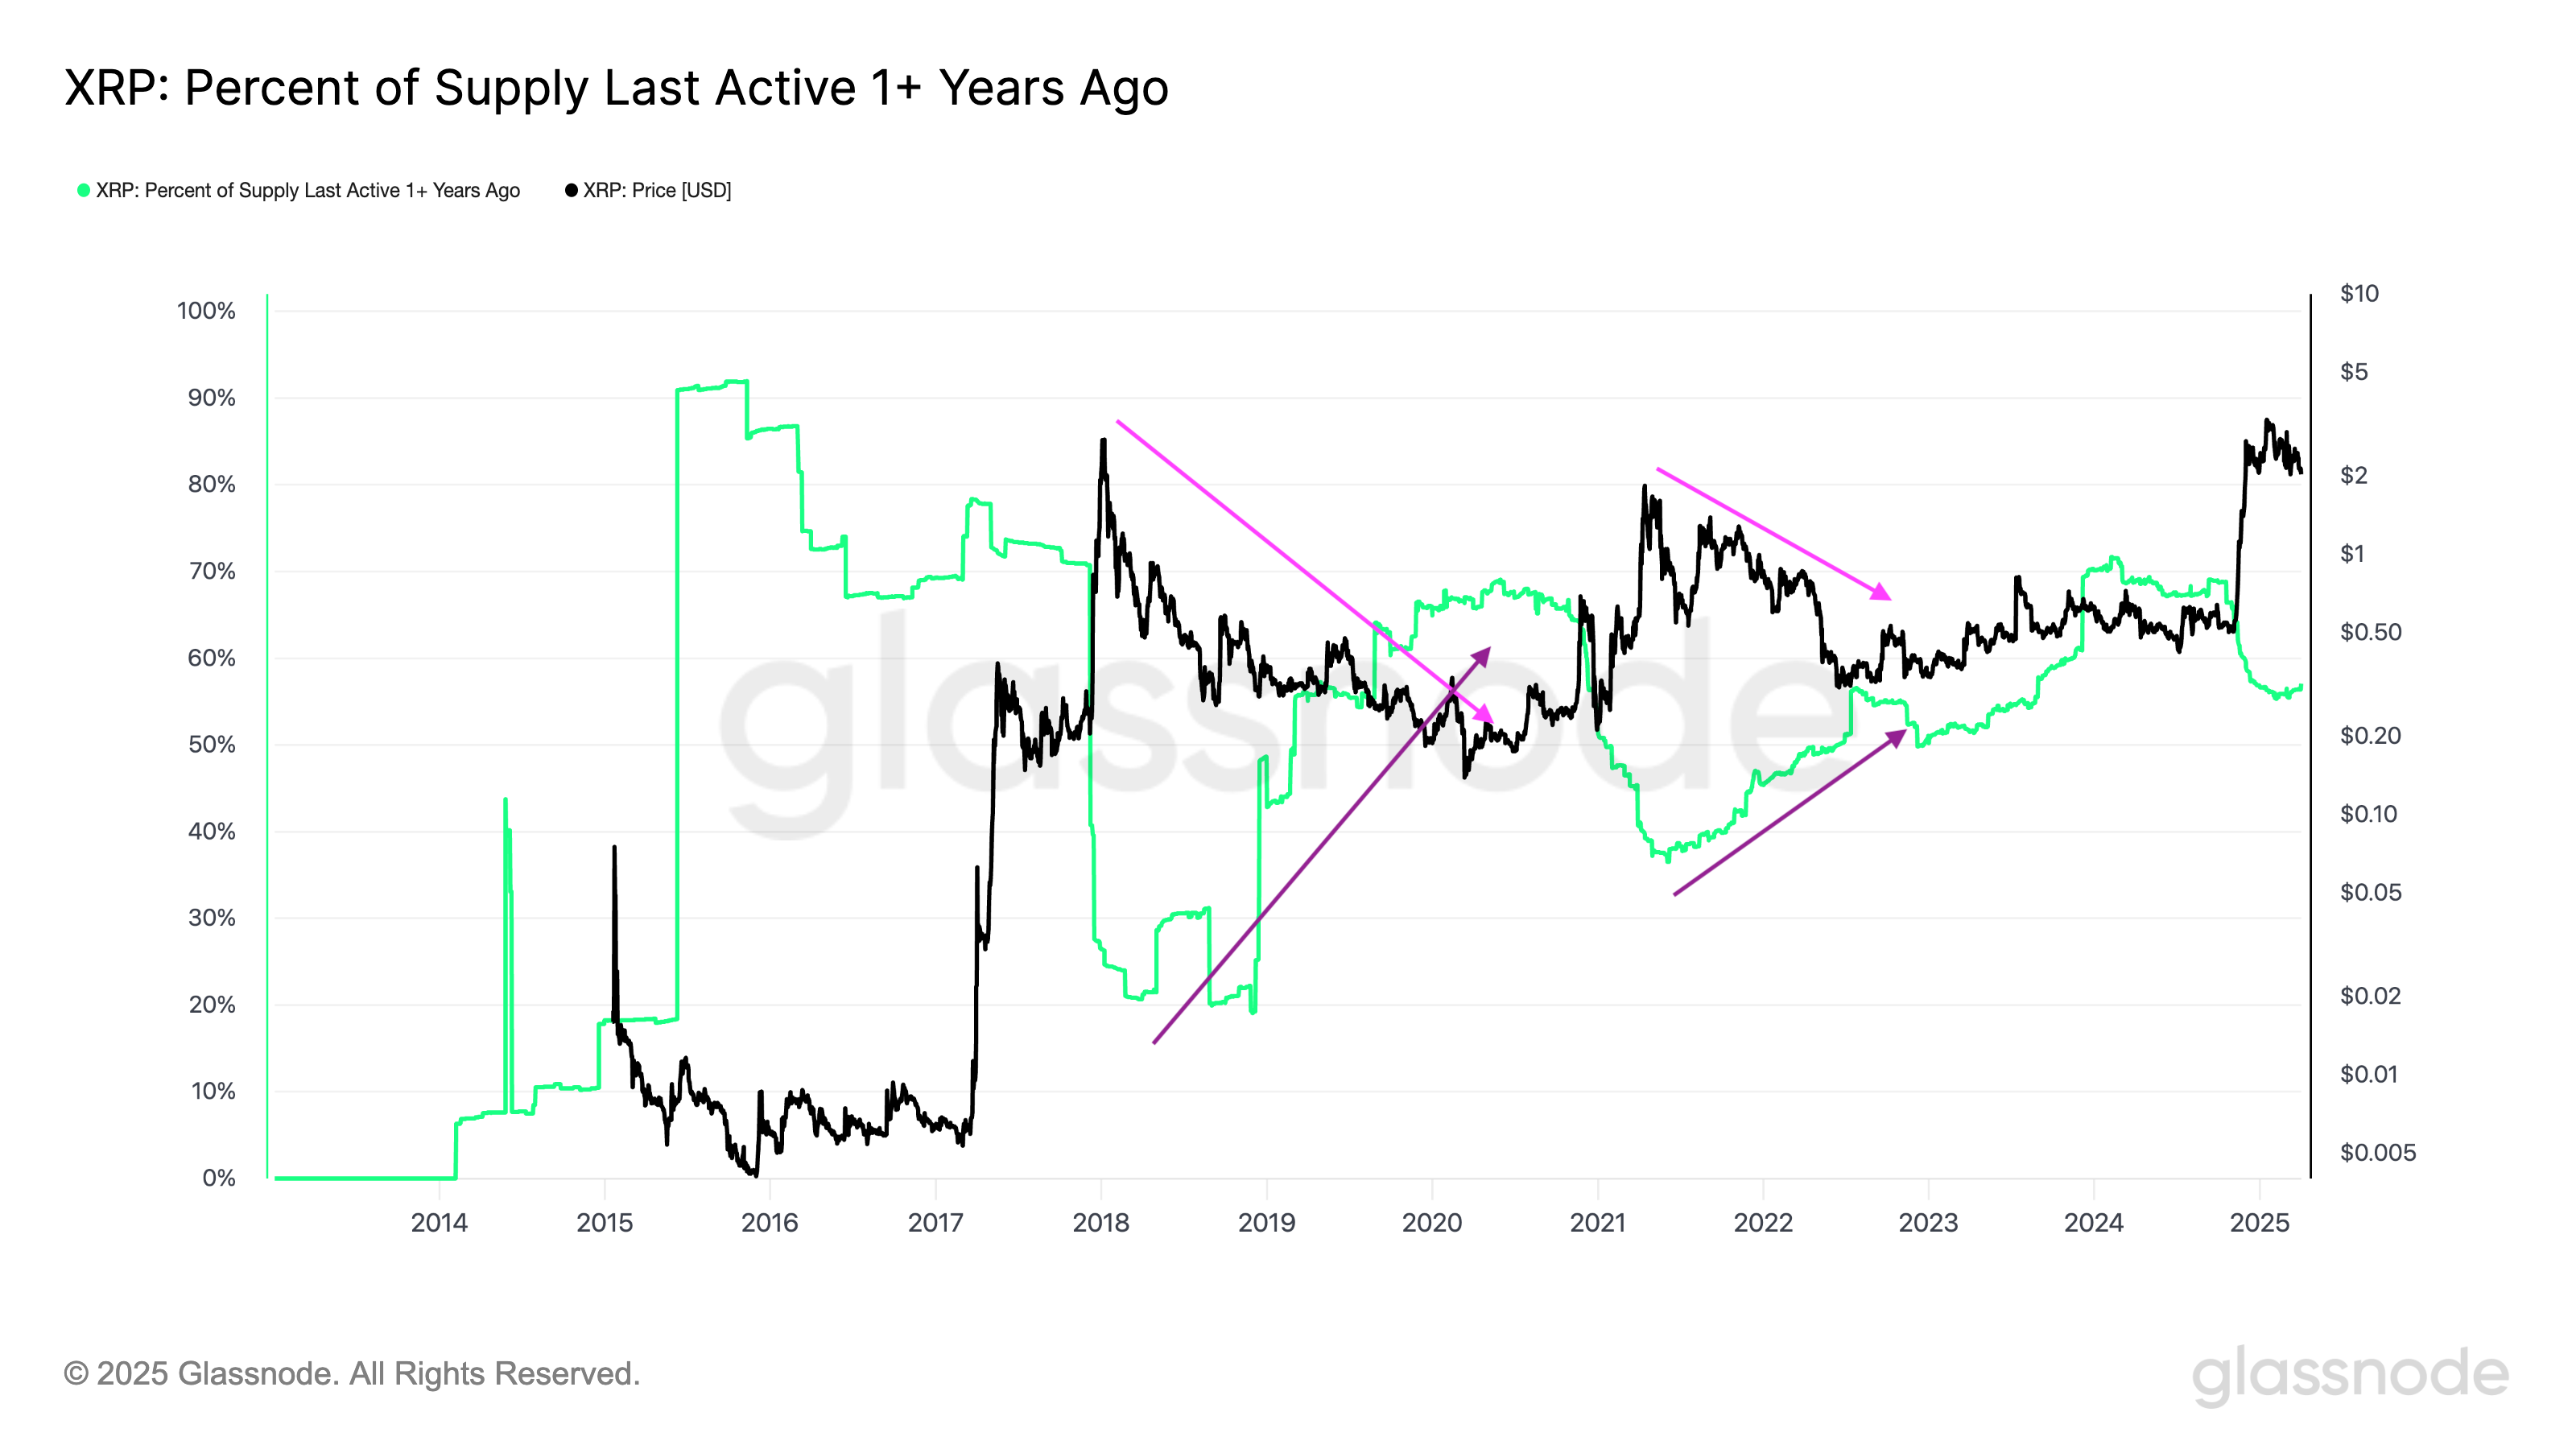
According to Glassnode data, “The percentage of the XRP supply was active 1+ years ago” XRP rises again after the sharp decrease during the beginning of 2025 over $ 3. This modest recovery shows that XRP investors, who have been still in motion for more than a year, have now begun to accumulate. This may be pointing to a renewed trust. However, past loops reveal a hidden risk: when this metric rises after a large sale, it usually coincides with price stagnation or short -term decreases.
During the XRP’s output to the perennial peak of $ 3.40, the inactive supply metric fell sharply. He also showed that long -term investors sell. However, this tendency has been reversed since February 2025 and shows that investors have looked again. The price of the XRP fell more than 30 %in the same period, which shows that long -term investors purchase price decreases. These metrics are reminiscent of the patterns seen in the bear markets in 2018 and 2021.
Historical patterns reveal a different situation
For example, at the end of 2017, the XRP coin price experienced a paraboolic rise extending to the highest levels of $ 3.55 dollars. However, this rally suddenly stopped shortly after a sharp increase in the activity between investors, which have long been still still and many of which evaluated the opportunity of sales.

 The percentage of XRP supply was finally active more than a year ago. Source: TradingView
A similar tendency appeared in 2021, when XRP climbed to a local summit of around $ 1.80. On-Chain data showed that there was an increase in the distribution of long-term investor, and then a short accumulation of accumulation. However, instead of firing a new bull run, a long price consolidation and downward pressure period came.
Therefore, these historical patterns show that the accumulation renewed after large sales may not always point to the beginning of a new rally and may indicate the beginning of a summit phase.
XRP Coin Technical Analysis: Indicators It points to 40 %decrease
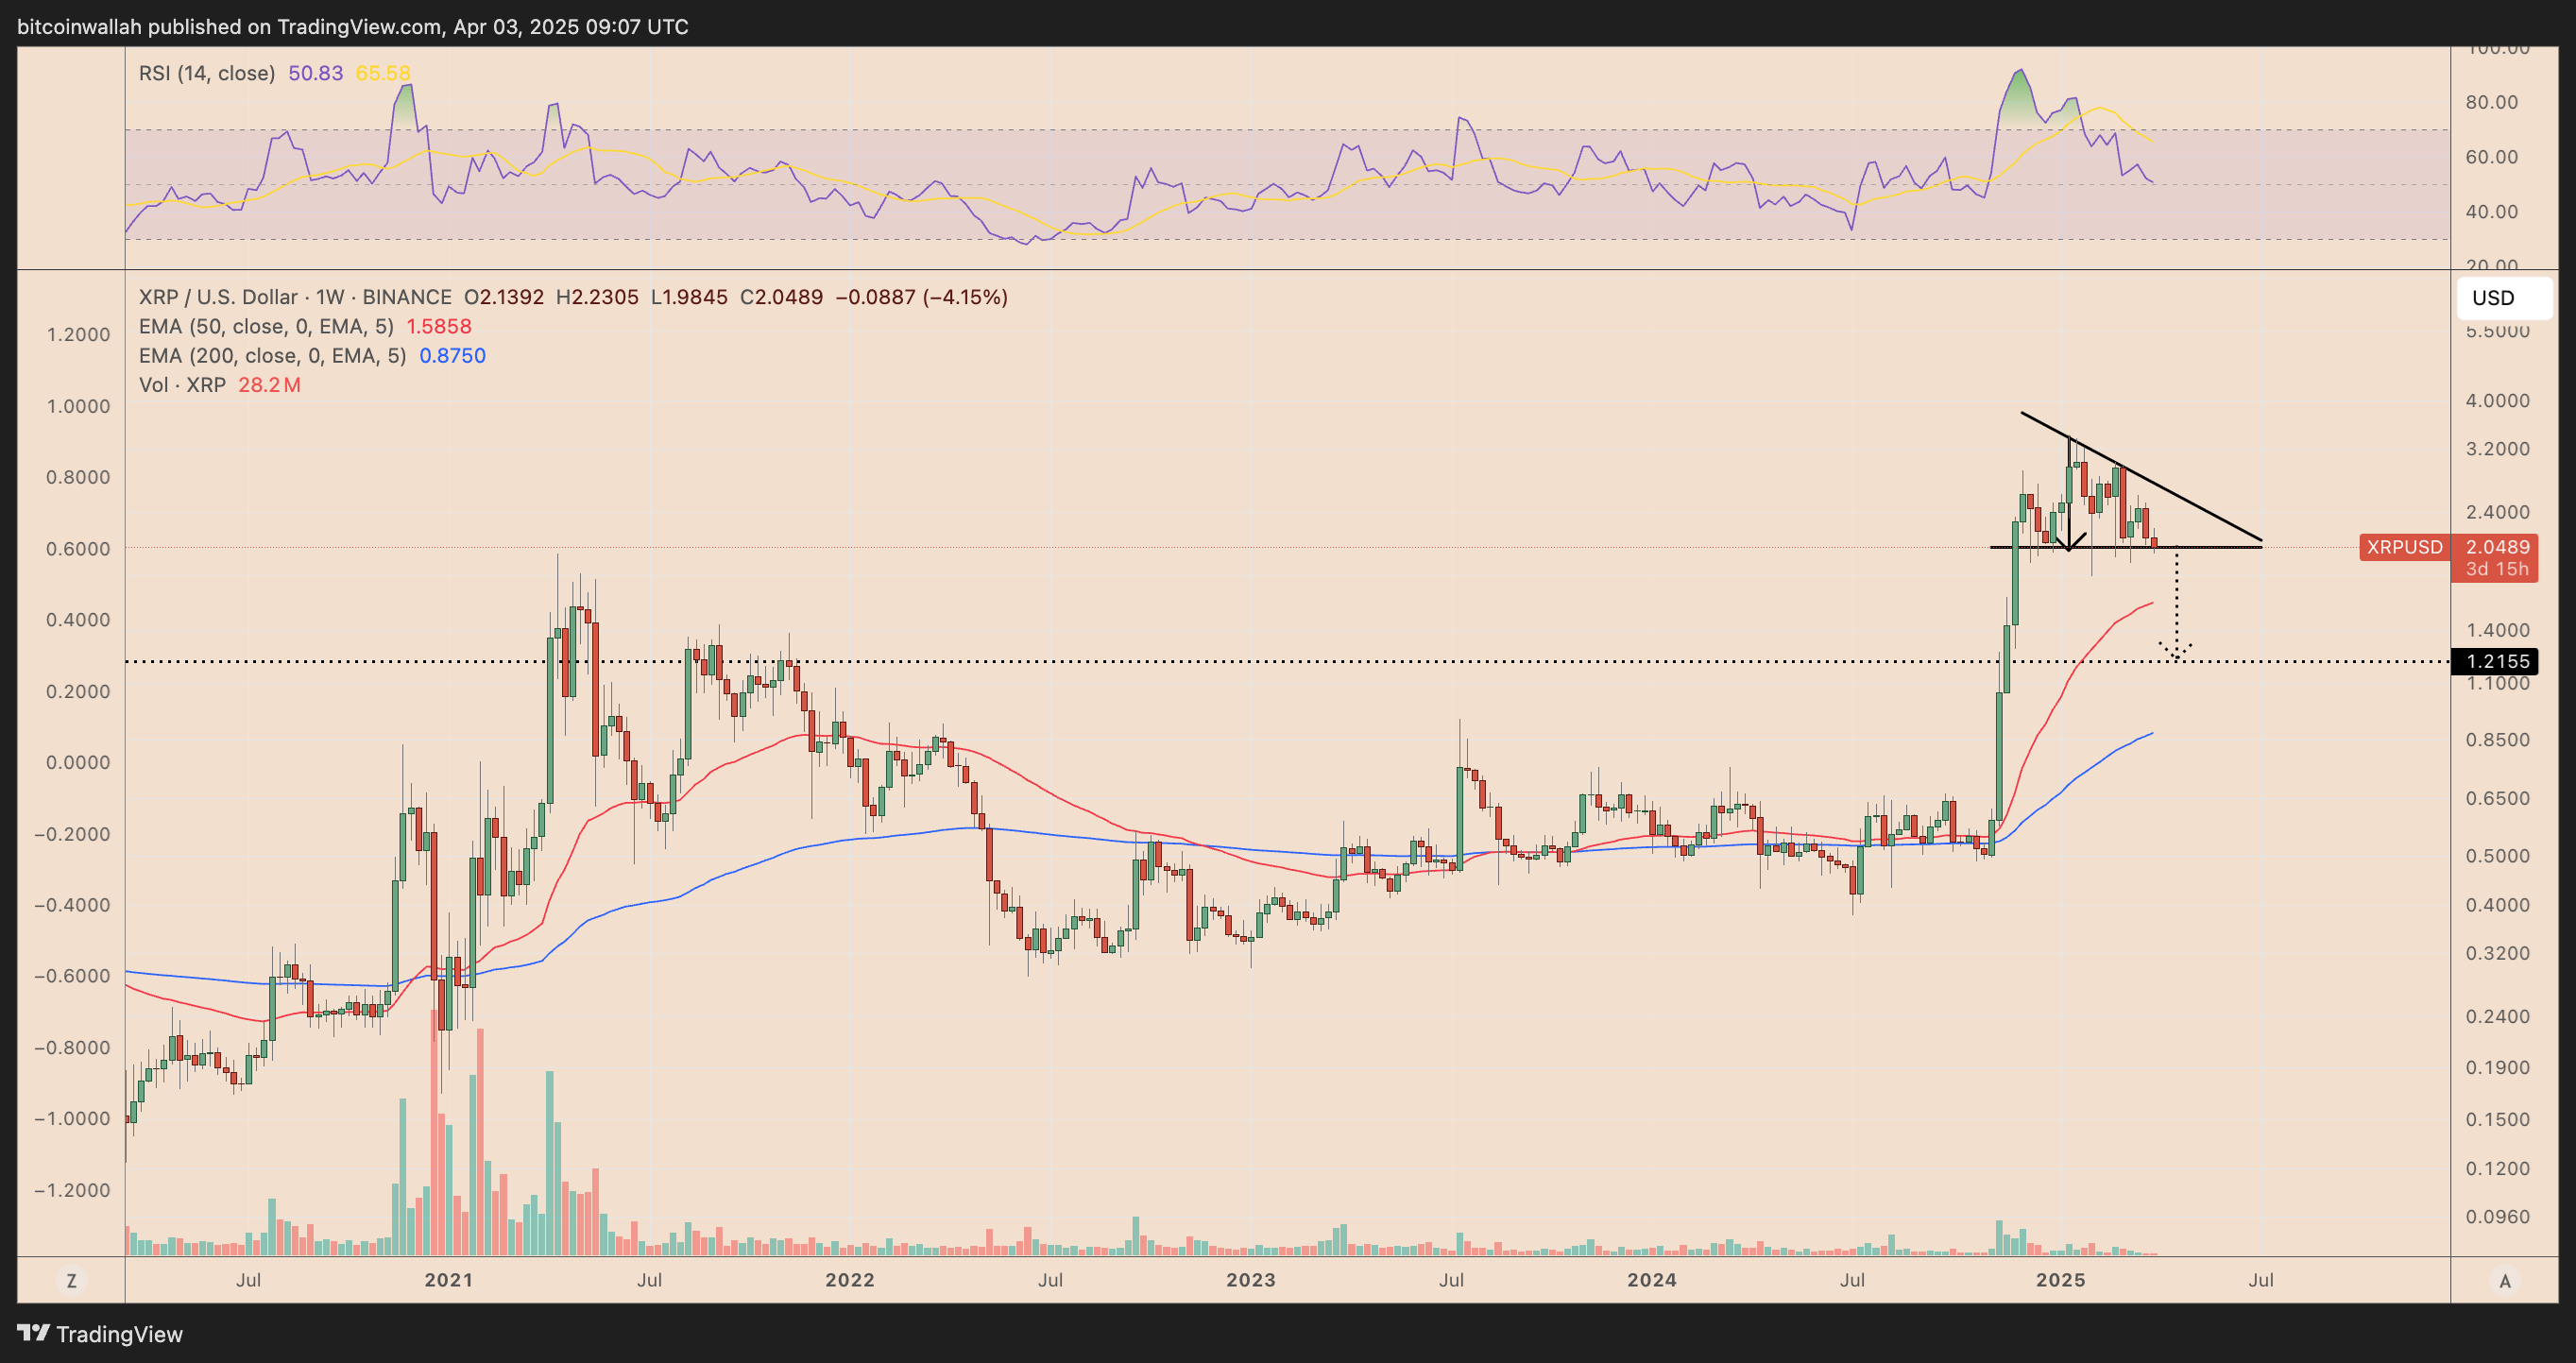
Another point that increases attention is the formation of a triangular formation that descends in the weekly graph of XRP. This formation is usually associated with collapse when it occurs after a strong rise. As of April 3, the XRP tested the $ 1,95-2,00 range as support, while it is traded below a number of low summits. According to the technical analysis rule, a decrease price below the support area may force the triangle as much as the maximum height of the triangle.
This shows that there is a possible decline target for around $ 1,21, which can now turn into support. In addition, this target is compatible with a significant historical resistance level since 2021. The decreasing RSI also shows a weakening momentum and supports the decline tendency more. Meanwhile, US President Donald Trump’s tariffs further strengthen the decrease tendency for XRP and wider -risk markets.
 XRP/USD weekly price graph. Source: TradingView


