Crypto analyst Valdrin Tahiri explains what awaits Stacks. Analyst Lockridge Okoth predicts that the XRP price will drop another 10 percent. Another analyst, Aaryamann Shrivastava, is expecting a drop for DOGE. According to analyst Filip L, an altcoin will fall into the hands of the bears. Crypto analyst David says ADA is facing a 20 percent drop.
Altcoin price prediction: Is a crash imminent?
The price of STX broke out of a descending resistance line on May 2. This line has been in place since March 20. After such breakouts, the price is expected to initiate a significant upward move. But STX failed to do so. Rather, it fell right after the breakout and is now trading at pre-breakout levels. This is considered a bearish sign as it casts doubt on the validity of the breakout.
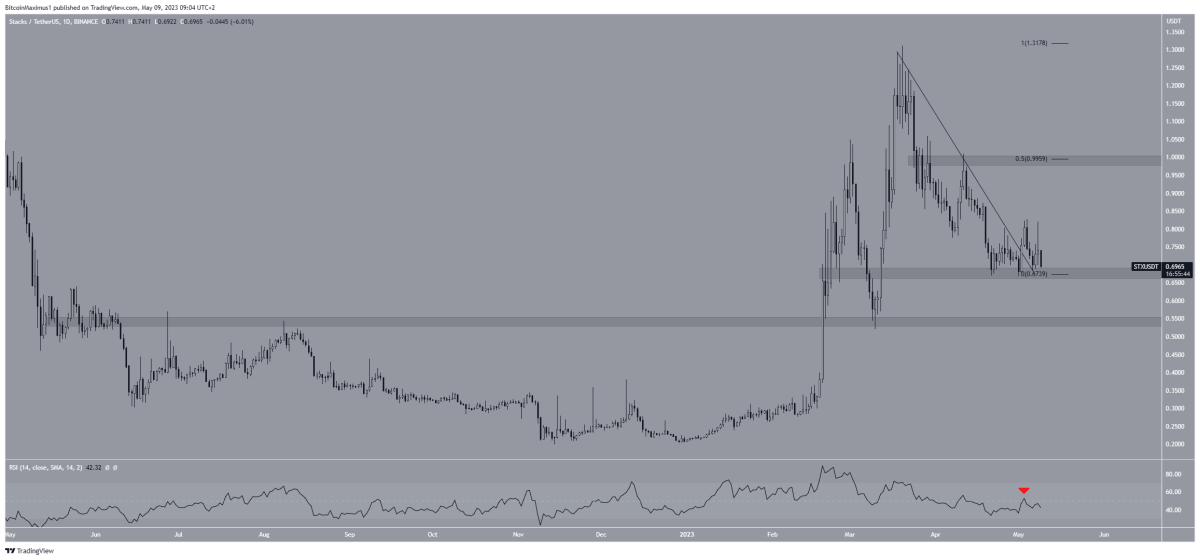 STX Daily Chart / Source TradingView
The Relative Strength Index (RSI) indicator also has a bearish outlook. If the RSI is above 50 and the trend is up, the bulls still have an advantage. However, if the value is below 50, the opposite is true. Current data is below 50, which is a sign of a bearish trend. Additionally, the rejection from the 50 line coincided with the failed breakout. So, it shows that this is not valid. Technical analysis on the short-term six-hour time frame indicates that STX is likely to start a significant downside move. First, price action within an ascending parallel channel is considered a corrective pattern. This means that an eventual deterioration from it is the most likely scenario.
The price is trading at the bottom of the channel making a breakdown more likely. Then, the RSI is below 50 and in the process of breaking out of the bullish trendline. If a price and RSI breakdown occurs, it will confirm that the trend is bearish and a drop to the $0.55 area outlined earlier will occur. Besides the current $0.67 support, the next long-term support area is at $0.55. On the other hand, the nearest resistance is at the $1.0 level.
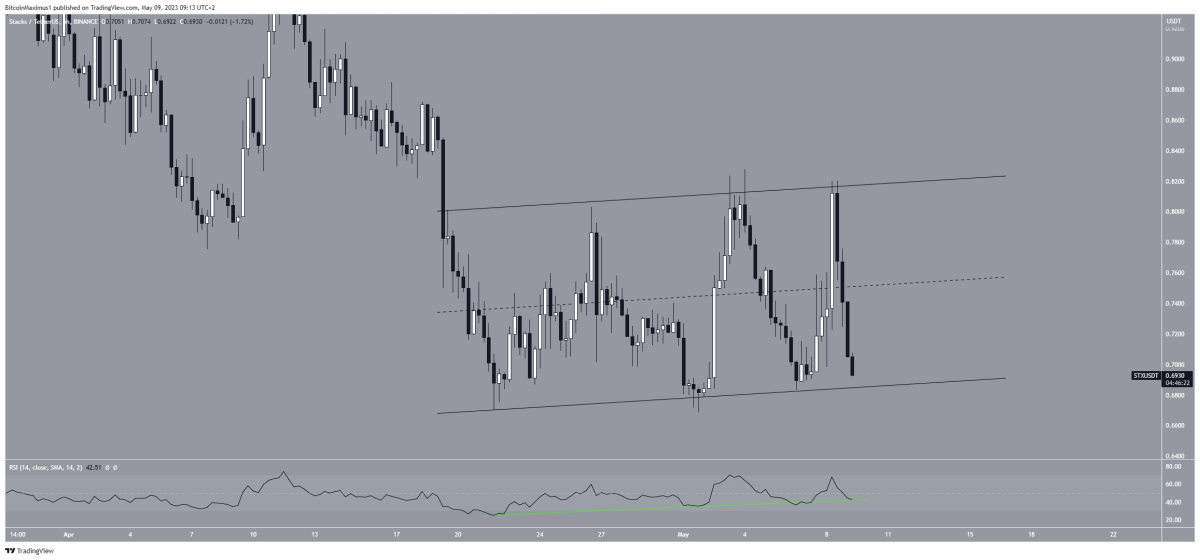 STX Six-Hour Chart / Source: TradingView
Therefore, if it breaks out of the channel, this bearish forecast will be invalid. In this case, it is possible for the altcoin price to move to the $1.0 resistance area.
Is Ripple preparing for a drop??
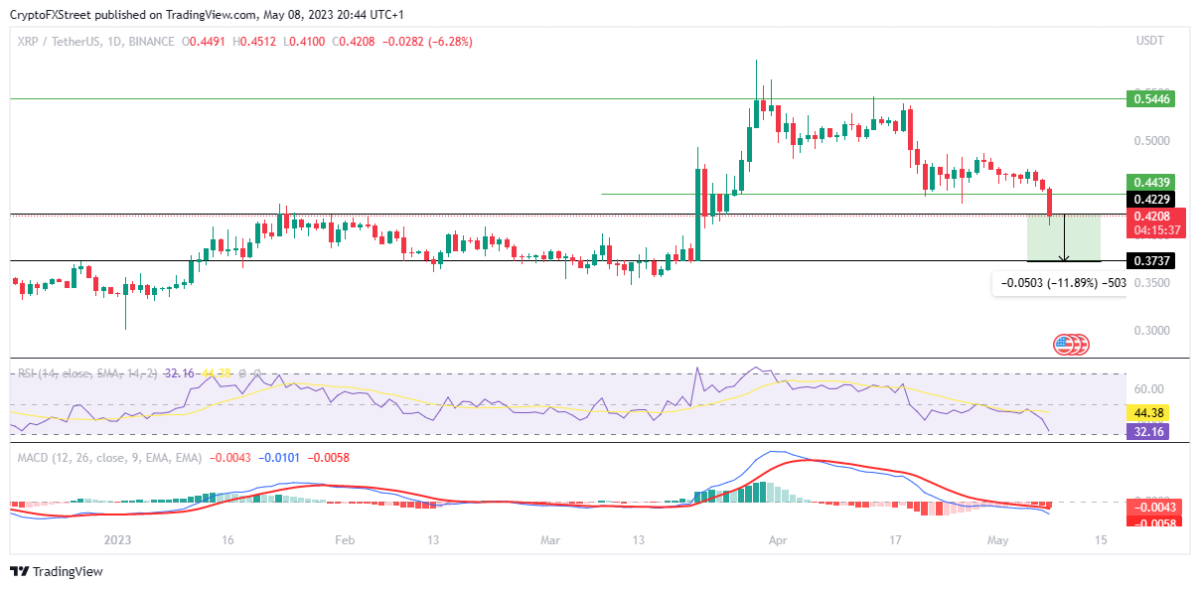
XRP price is down almost 10% in the last 24 hours. However, the downward trend Hoskinson instilled could fuel another 10% drop. Thus, the altcoin price may continue its downtrend as the dark clouds over the XRP ecosystem thicken. cryptocoin.com As you follow, the Ripple and SEC conflict has flared up again. On top of that, XRP dropped below critical support at $0.44. The altcoin is now tied to the critical support of $0.42. An increase in seller momentum below this level could cause XRP to revisit the March 21 low around $0.37. This means a 10% reduction from the current price.
 XRP 1-day chart
Conversely, if XRP bulls and individual traders decide to buy the dip, the altcoin price could pull back. The increase in buying pressure is likely to push XRP above the critical level of $0.44. Thus, in a bullish high, it could facilitate a flight above the psychological $0.50 resistance level. However, the bearish outlook for the altcoin is invalidated by a daily candlestick close above $0.54.
Dogecoin price dropped
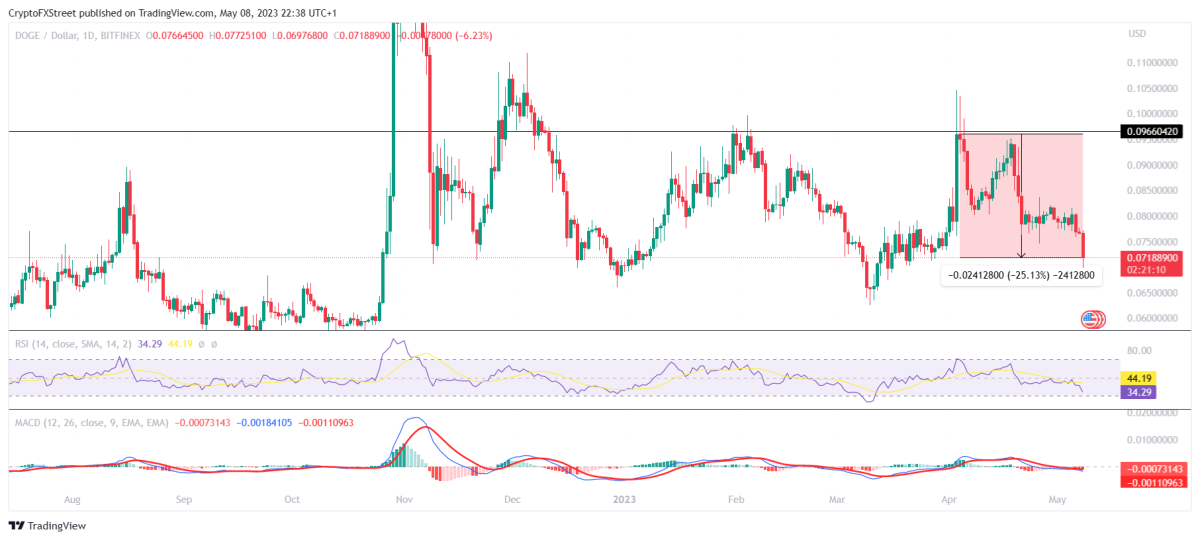
DOGE price is down 6.3% in the last 24 hours. During the intraday trading hours, the bearish divergence increased significantly, bringing the DOGE down nearly 9% at one point to $0.069. However, the slight eventual recovery resulted in DOGE losing just over 25% of its value last month.
 DOGE 1-day chart
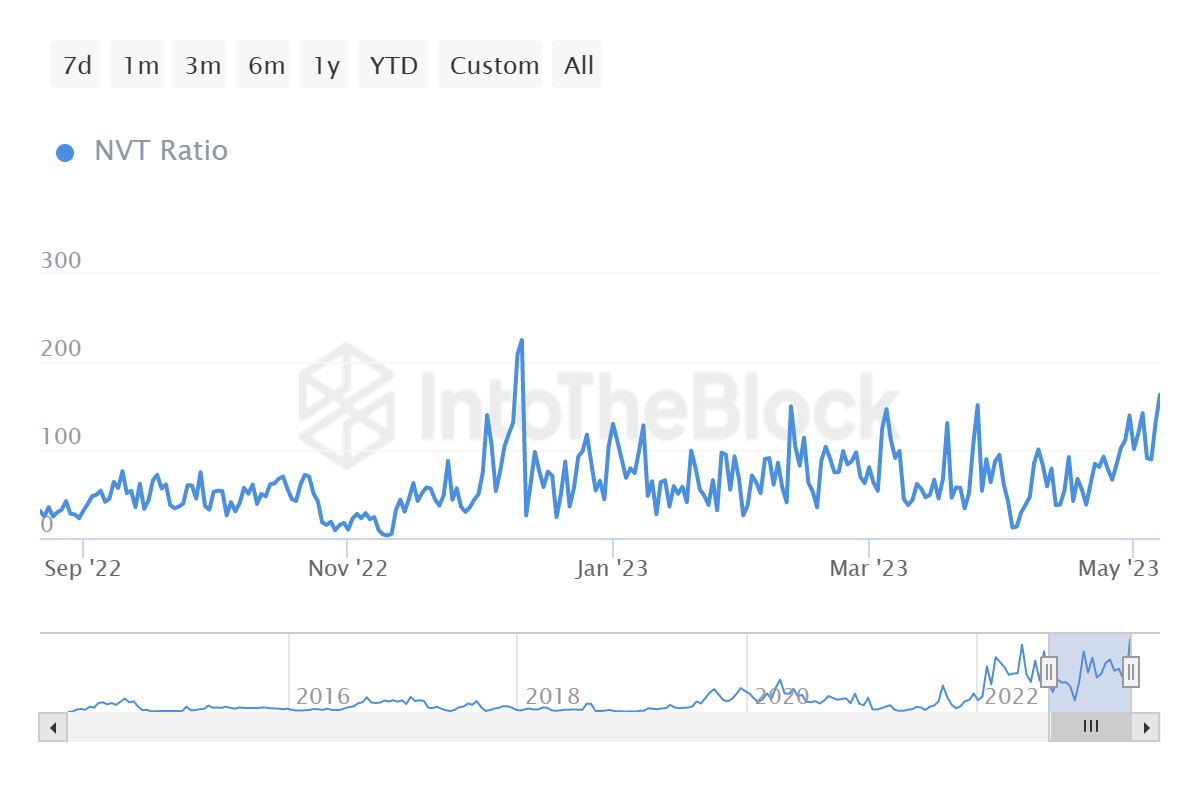
While broader market cues play a role in price action, the same was expected given the increase in Network Value to Transaction (NVT). The ratio measures the network value, i.e. the market value of the cryptocurrency, relative to its trading volume and value consensus. This helps an investor gauge whether the crypto is overvalued or undervalued. High NVT values are associated with overvaluation. Also, while noting the market’s highs or corrections, low NVT rates indicate the opposite.
NVT for DOGE is at a five-month high of 163, last recorded in December 2022. At that time, DOGE failed to recover. It also recorded another 21% drop over the next seven days.
 Dogecoin NVT rate
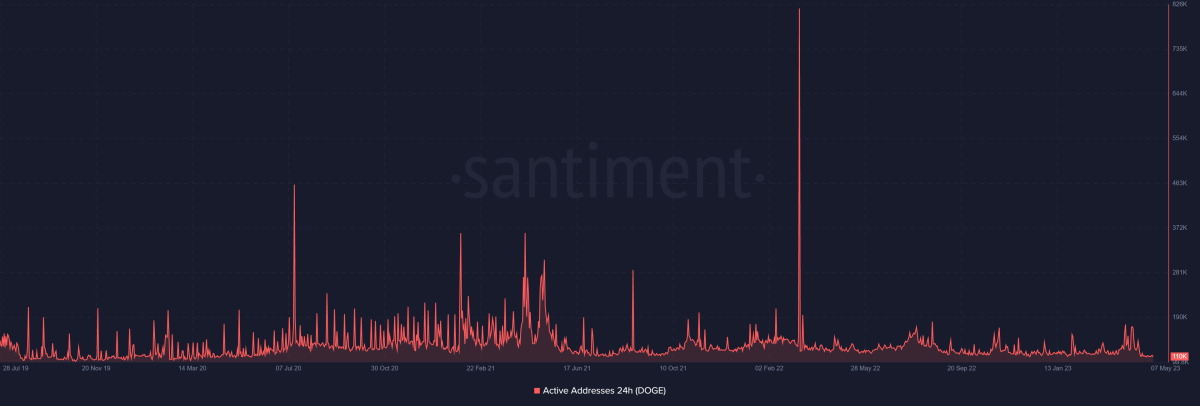
Now the on-chain transaction value has exceeded the altcoin value. So some fixes will fix the inconsistency between the two. This development frightened investors to the point that they avoided joining the network in early April despite some good numbers. Toward the end of the month, active addresses dropped from 142,000 to 117,000 in 48 hours.
 DPGE active addresses
The Dogecoin network last registered less than 120,000 users about two years ago, in July 2021. This indicates that traders will remain low until they see some recovery in the charts. Fixes need to expire for the same to happen. This is likely given that the Relative Strength Index (RSI) is approaching the oversold territory. This region is synonymous with recovery. Also, if the altcoin falls into this zone, some green candlesticks will likely be on the way.
This altcoin will lose another 10%
The MATIC price action is due to a previously announced sell-off that is expected to happen soon. The signs on the wall have been there since the end of April and are clearly visible on the chart. Experienced technical traders will have noticed that after the failed attempt to reach $1,064 on April 26, the tops came lower and confirm the heavy selling, which is now playing its last game.
MATIC saw a few brave bulls buy the low at $0.88. However, that was a little early. With global markets falling as well, a bit more headwind is possible with sticky selling pressure at hand. Instead, look for MATIC around $0.82 or even $0.79 for enough support to see new buys stopping sell-off with a reversal.
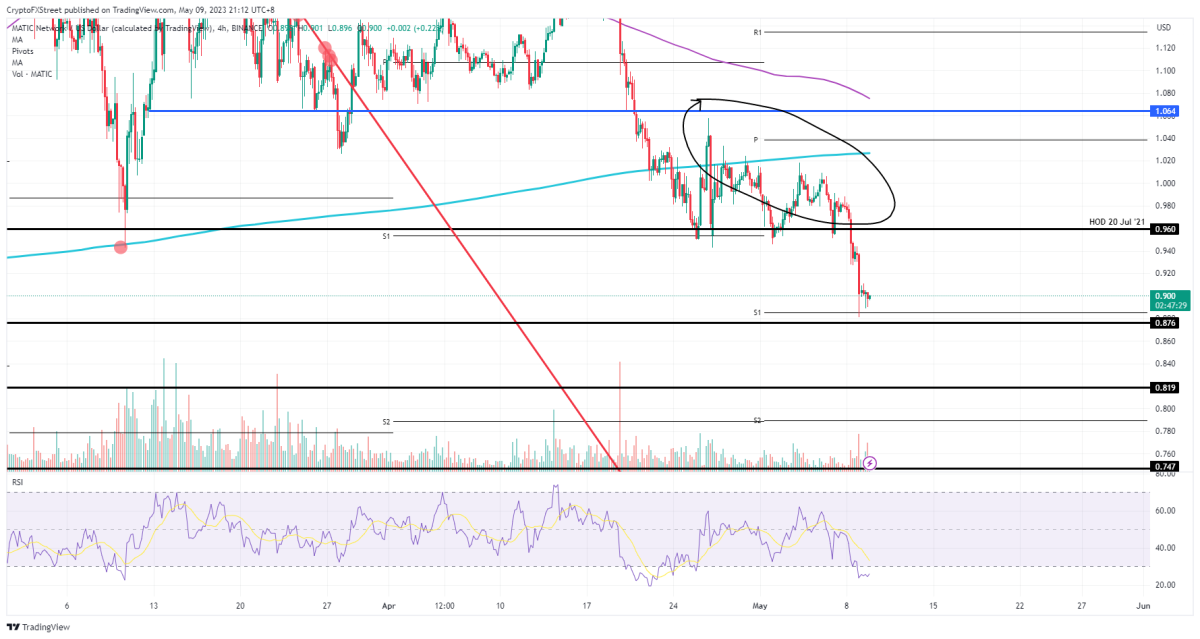 MATIC 4-hour chart
Price action is flirting with $0.90. Moreover, it has already crossed the oversold barrier of the Relative Strength Index (RSI). Thus, it is possible that the selling pressure will begin to subside quite quickly. This will make room for further improvement with some small wins on hand. Undoubtedly, $0.94 means at least 5% gain on a minor recovery.
ADA is about to fall into the hands of bears
Cardano has been forming a bullish structure since hitting a low of $0.24 at the end of December 2022. This increase helped the price climb above the horizontal resistance level of $0.42 for the week of April 10-17. It also helped it reach the year high of $0.46. However, it formed a bearish engulfing candle the next week and settled below the $0.42 level. This is a bearish signal and usually leads to a sharp decline afterwards.
Indeed, after confirming the $0.42 level as resistance during the week of April 24 – May 1, ADA broke below the low of the engulfing bearish pattern ($0.38), marking the continuation of the previous decline. Therefore, it is possible for ADA’s bull hand structure to test the important support level at $0.3. This indicates a decrease of about 20% from the current level. The weekly RSI indicator supports this possibility as it dips below 50 and is trending downwards.
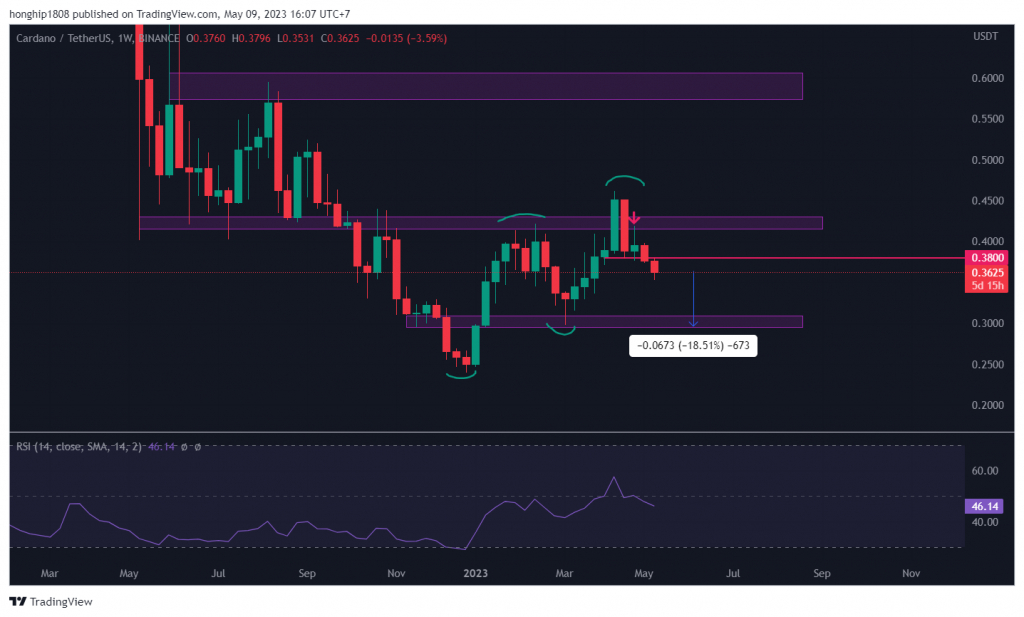 ADA weekly chart / Source TradingView