The recent correction in the crypto market has uncovered new opportunities on several altcoins. Still, analysts like famous trader Capo predict that we will see another correction before this one.
Capo expects deep correction in biggest altcoins
Updating his technical analysis on his Telegram channel, Capo drew attention to Binance Coin (BNB), Ethereum (ETH) and Polygon (MATIC). The technical analyst says that we will see $40 with a 83% drop in BNB price.
Binance Coin (BNB): $40 down 83%
Capo’s analysis points to an alarming future in Binance Coin (BNB). It predicts a prime price target of around $40, reflecting a significant 83% drop from its current value. The analyst links the cryptocurrency of the FTX exchange FTT to BNB. The current price of Binance Coin predicts it will crash from $240 to $40.
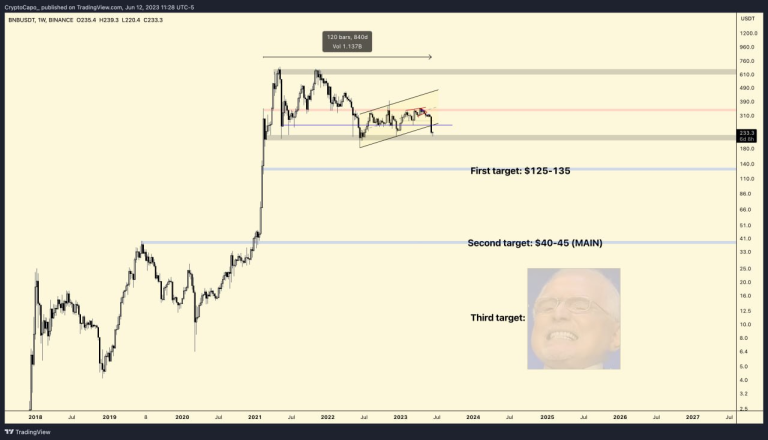
Meanwhile, BNB price has been trading in an ascending triangle pattern since May 2022. This is also a bullish pattern that leads to breakouts in most cases. Different technical analyzes show that the most likely view in the short term is to the downside. The closest target is at $222 and below the $104 target of the triangle. cryptocoin.comAs we have reported, breaking the $220 BNB price will trigger a major liquidation in the DeFi market.
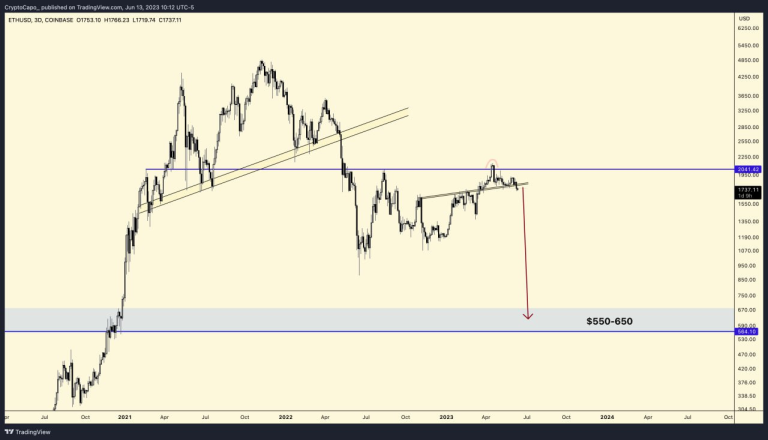
Ethereum (ETH): Cross support broken, estimated 60% drop
Capo stated that ETH has already broken a diagonal support level. He expects $550 to $650 as his next targets. These levels represent a 62% drop for ETH. ETH is currently trading above $1,700.
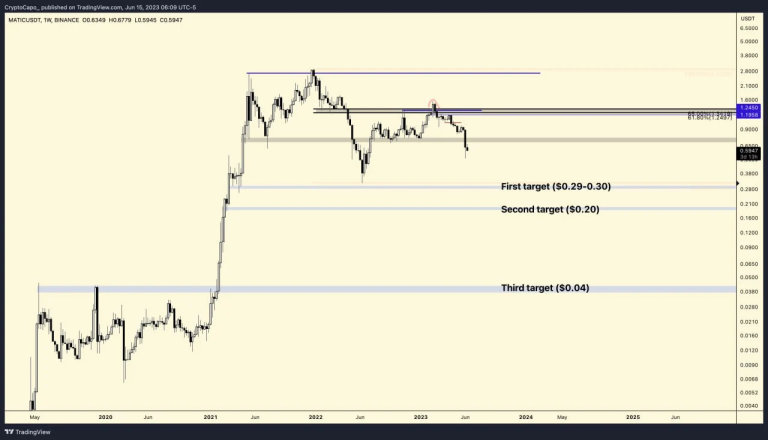
Polygon (MATIC): $0.04 down 93%
The crypto analyst expects a dramatic price drop for MATIC with targets as low as $0.04. This means that MATIC investors will see a loss of 93%. Capo highlighted the success of BNB-like shorts and outlined the creation of multiple targets for MATIC. MATIC is currently trading at $0.60. The analyst says that short positions in all three altcoins will be profitable in the short term.
XRP price could see lower levels
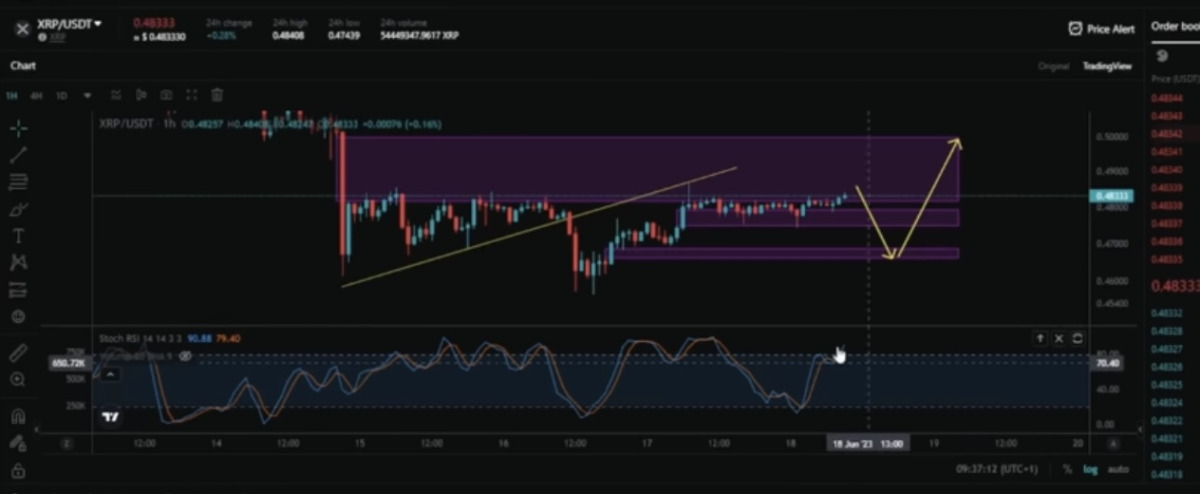
The XRP price has managed to stay afloat despite the SEC litigation of the past weeks. However, it is facing a key resistance level below $0.50, according to Cheeky Crypto. As a result, the analyst expects XRP price to continue falling towards $0.46 to gather more liquidity.
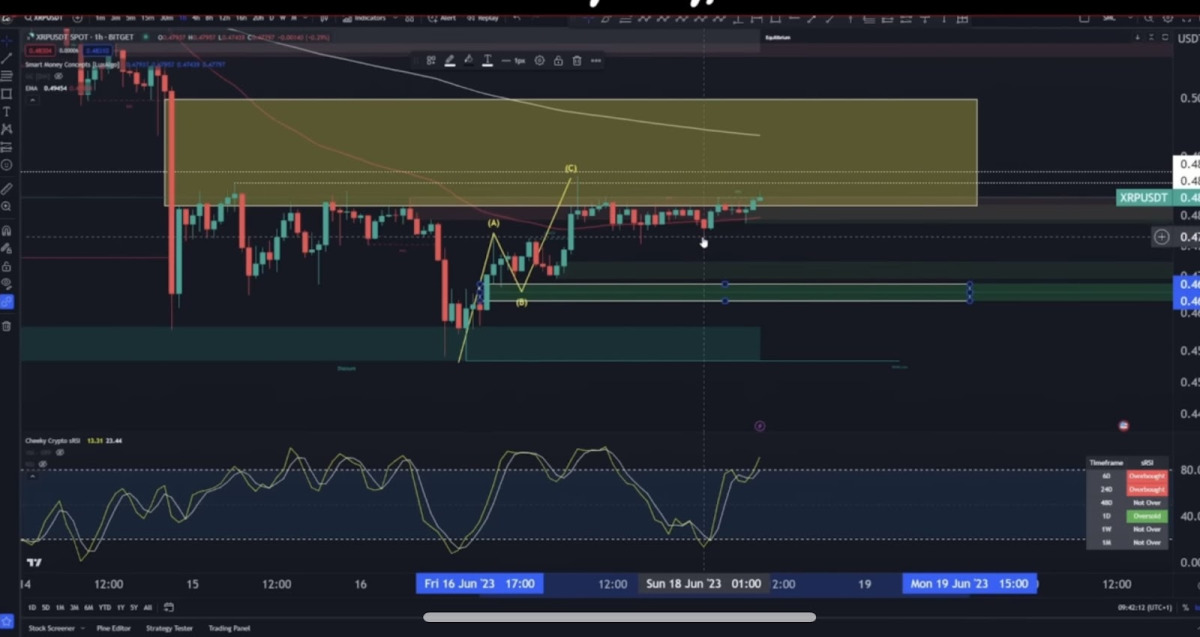
In particular, the Stochastic RSI at 14 reexamination periods, which basically tells traders the strength of momentum based on the volume behind it, provides crucial insights into demand-driven analysis. The analyst noted that on the 2-hour chart, the Stochastic RSI shows that demand is approaching the overbought zone, signaling an impending price reversal.
Stellar (XLM) price shows signs of recovery
The daily time chart shows that XLM price is in a downtrend. It shows that the price has fallen since April 1, its annual high of $0.115. On June 10, it broke from an ascending support line that has been in place for 163 days. Breakouts from such long-term structures often lead to sharp downward moves.
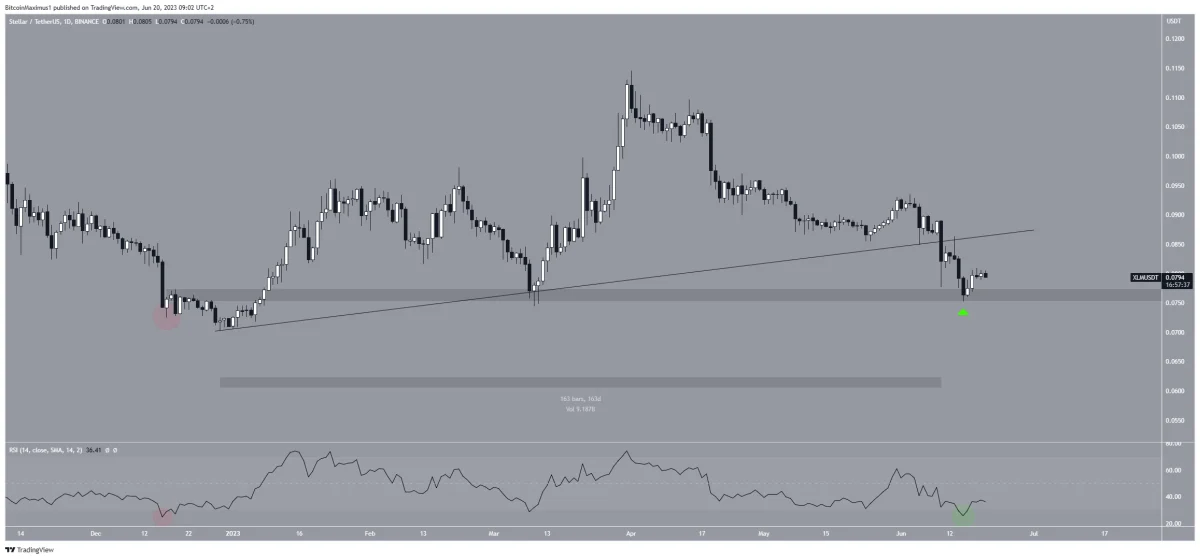
On the broader chart, the most critical resistance for XLM price is at $0.087. If it fails to break this resistance, the bears will move towards $0.070. Technical analysis shows that in an extreme bullish situation, the bulls will make moves to $0.094 and $0.115.
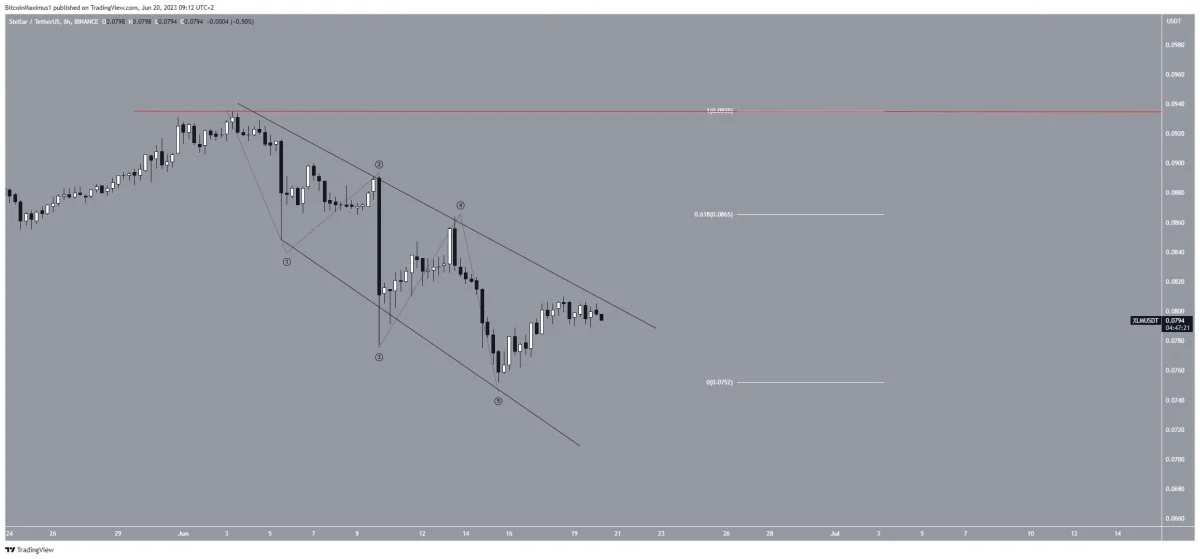
While the short-term XLM price prediction is bullish, failing to break out of the wedge and drop to $0.075 will mean the trend is bearish. In this case, an immediate drop to $0.070 and a possible break to $0.050 would be the most likely scenario.


