Gold continues to trade at five-month lows after Friday’s U-turn. US dollar pullback allows bears to take a breather before important data/events. The options market points to bearish dominance, with recession fears putting downward pressure on them. So what’s next?
What were the latest developments affecting the gold price?
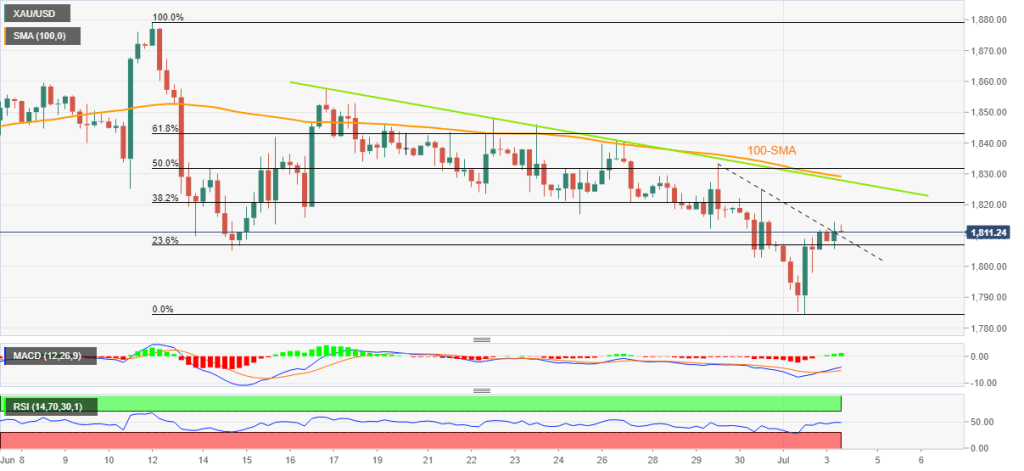
Gold price (XAU/USD) seems to have started to recover while it is around $1,812. During the US holiday, US dollar buyers breathed, and the precious metal rose for the second day in a row. However, the US Dollar Index (DXY) remains under pressure around 105.00 after renewing its two-week high the previous day. DXY’s recent consolidation remains in line with market preparations for the week’s key data/events, including the US Independence Day holiday, the week’s Federal Open Market Committee (FOMC) Minutes, and the US jobs report for June.

cryptocoin.com As we reported, the gold price dropped to a five-week low after Friday’s US ISM Manufacturing PMI data caused recession woes. June’s US ISM Manufacturing PMI fell to 53.0, the lowest in two years, compared to the previous expectations of 54.9 and 56.1. ANZ Bank analysts used the following statements, considering the data:
Survey data from both PMIs and the US ISM all point to slower buy/sell order growth, reduced backlog workloads in business indices and less production over the summer. It’s hard to escape the growing pessimism that fuels peak expectations in both inflation and central bank falconry.

What does the technical data point to?
On the other hand, the options market indicator, called risk reversal (RR), calculated by the difference between buys and sells, is trending bearish as the daily RR drops to -0.195 for the fourth consecutive day, to a one-week low. Also, the monthly RR fell to -1,220 in June, the lowest since February. S&P 500 Futures reflected a similar tone. According to Anil Panchal, an analyst, the US holiday; It could allow gold prices to consolidate recent losses. But the bears remain hopeful ahead of Wednesday’s Federal Open Market Committee (FOMC) Minutes and the June US Employment report due Friday.
On the other hand, breaking the three-day descending trend line to the upside indicates short-term recovery movements in the gold price. Hopes supporting the corrective retracement are also taking cues from the tighter RSI and bullish MACD signals on the four-hour chart. However, the convergence of the 100-SMA and the 12-day descending trendline seems to be difficult for metal buyers to break near $1,830. Alternatively, confirmation is needed near $1,806. Finally, the analyst points to $1,800, $1,780 and $1,760 as support levels to watch.

How will Bitcoin be affected?
So, how will the new data that will be announced this week affect Bitcoin? Currently, Bitcoin (BTC) is more associated with stocks than gold. That is, investors see BTC alongside risky assets. If the risk sentiment in the market rises as a result of the data, an increase can be expected in BTC as well as stocks. At the time of writing, BTC is changing hands around $19,000.


