Weekly, daily and four-hour charts for gold are out. The analyst determined various price levels by analyzing the charts. Accordingly, the precious metal reveals interesting results this week. The Jackson Hole symposium to be held by the FED acts as an important driver for the price. Cryptocurrencies and commodities await what the Fed chair has to say about the economy at the symposium.
Gold is in a downtrend
Gold broke a critical support structure reinforcing the bearish trend on the daily chart as shown below. Thus, it ended Friday with a decrease of approximately 0.62%. Basically, all eyes were on the words of President Jerome Powell. cryptocoin.comAs we have reported, Jerome Powell will be speaking at this week’s Jackson Hole symposium.

At the meeting, it remains unclear whether Powell will step back from his previous hawkish remarks. However, it seems that it will bring great volatility in the value of all kinds of crypto and gold. However, TD Securities analysts expect a capitulation to occur below. Analysts, who think that the Fed will continue its hawkish stance, said:
“As market expectations for rate cuts fade, the bullish sentiment in gold’s value will diminish even more.”
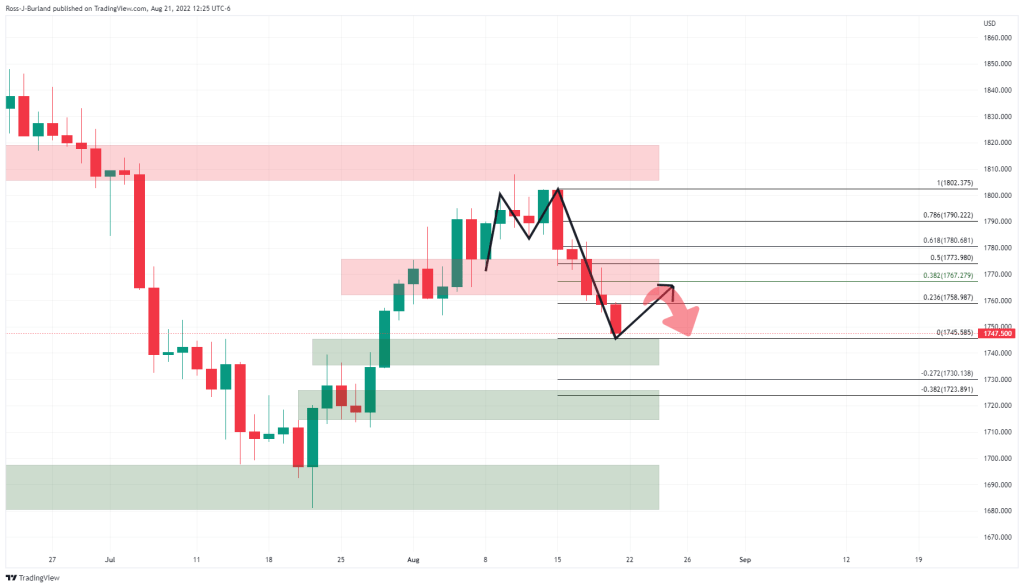
daily chart
The support levels on the daily chart are based on the volume profile of the bull trend. However, the resistance at $1760 has a combination of previous lows and structure and the 38.2% Fibonacci area. The M-formation seems to pull the price to at least the $1,754 structure. This pattern is a reversal pattern that is expected to put a touch there on the opening days of the week. However, a downside continuation without a near-term correction will bring $1,720 to the table.
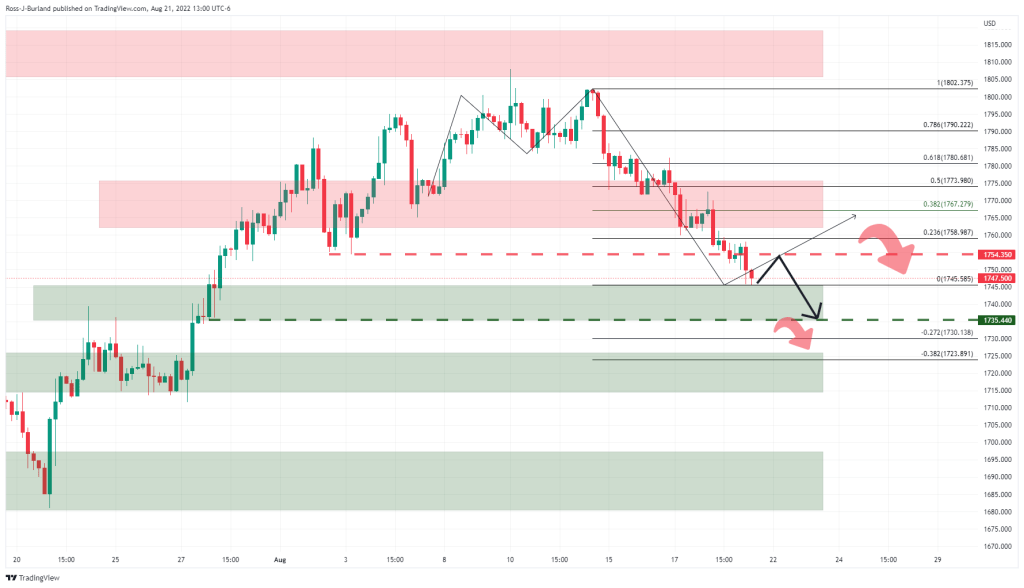
monthly chart
A break at $1735 on the monthly chart for gold will be key in the near term. Accordingly, we expect a decrease in the price of gold to $ 1735. After that, the continuation of the downtrend may cause the price to see lower.
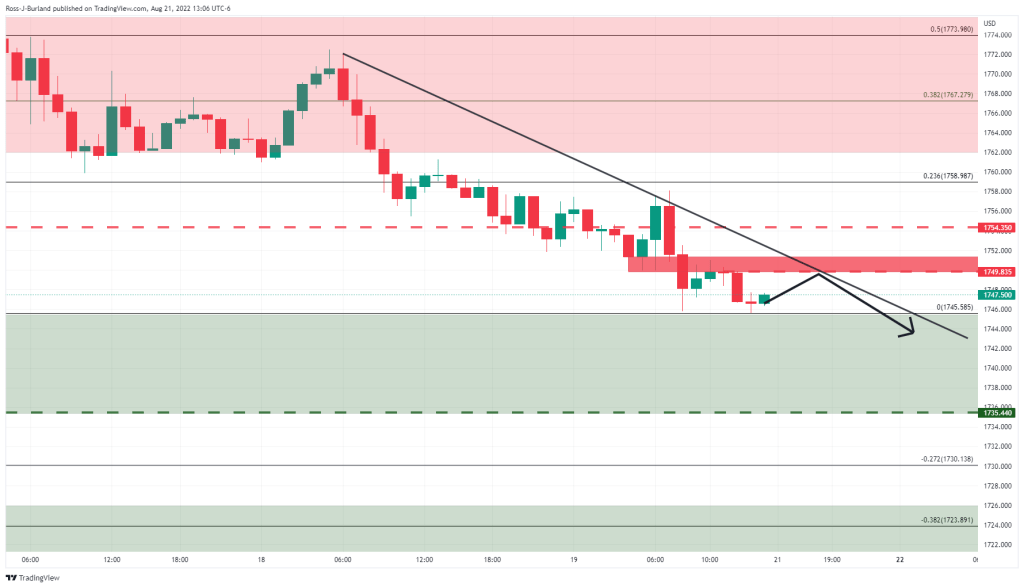
hourly chart
For the opening, the trendline resistance at $1750 and the closing highs will be a key feature for the price of gold to hold the upside on the hourly chart. Receiving these levels has the potential to push the price higher. However, an opening below this level seems to cause the price to drop as low as $1742. After that, a move to $ 1735 will come to the table.