Gold prices opened the week with a rise and managed to climb above the $1,760 level. However, there are critical data on the agenda for the week and important technical levels for gold. Analyst Ross J Burland says that gold lingers on the offer and eyes are on the breaking of the 4-hour resistance. According to the analyst, Fed speakers will likely be a critical theme for the gold price this week.
Market will follow Fed speakers closely
Gold closed higher on Friday as dollar and bond yields fell. However, it only managed to make a small weekly gain on expectations that the US Federal Reserve would withdraw its rate hike stance. The price of the precious metal rose more than 6% last month on such expectations. So next week is going to be pretty important in that regard.
Fed Chairman Jerome Powell and NY Fed chairman James Williams will make the headlines on this week’s Fedspeak, analysts at TD Securities say. They also expect both to make it clear that the tight labor market and rising services inflation require the Fed to continue the march, and possibly longer. In this context, analysts make the following statement:
Markets welcomed the possibility of a lower bid. However, we expect them to counter this by emphasizing the need to achieve an appropriately higher final interest rate.
Gold price technical analysis: Gold bulls are on the move
Technical analyst Ross J Burland analyzes the gold price technical view on the charts. Below is the current situation in a multi-time analysis of gold price.
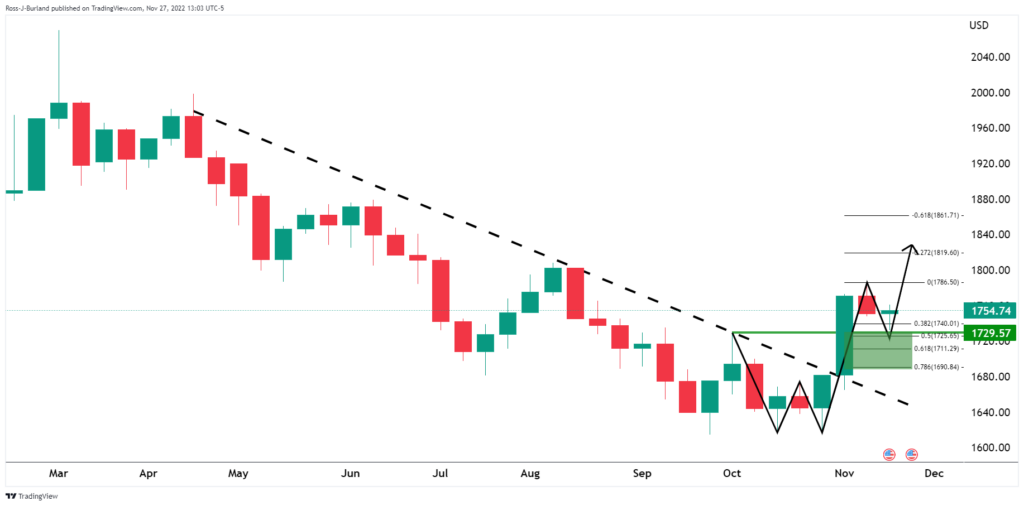 Gold price weekly chart
The price is returning to the structure around $1,730. It’s also possible that it has a little more time to go for deeper tests on the Fibonacci scale. However, the trend that is on the backside of the trend is bullish in the long run.
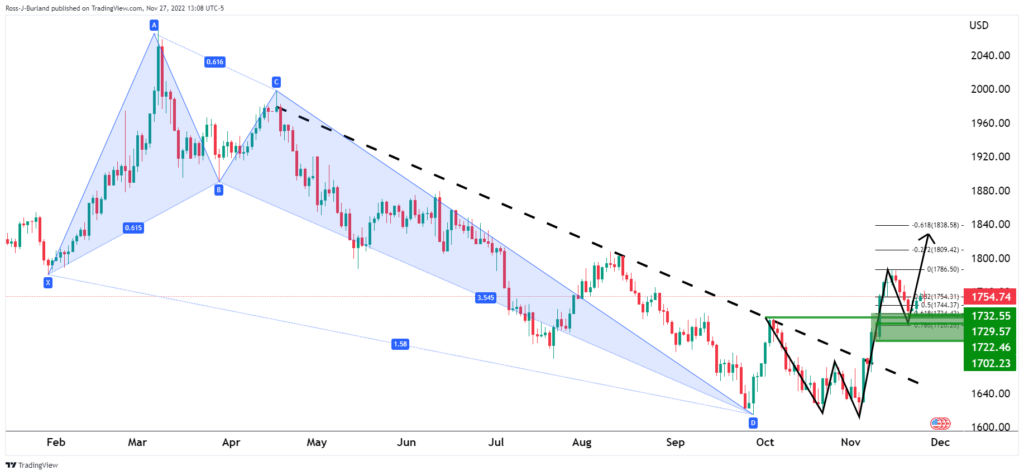 Gold prices daily chart-1
The harmonic pattern of the daily chart is also bullish. The price has already corrected 61.8% of the previous bullish impulse. Here he finds support.
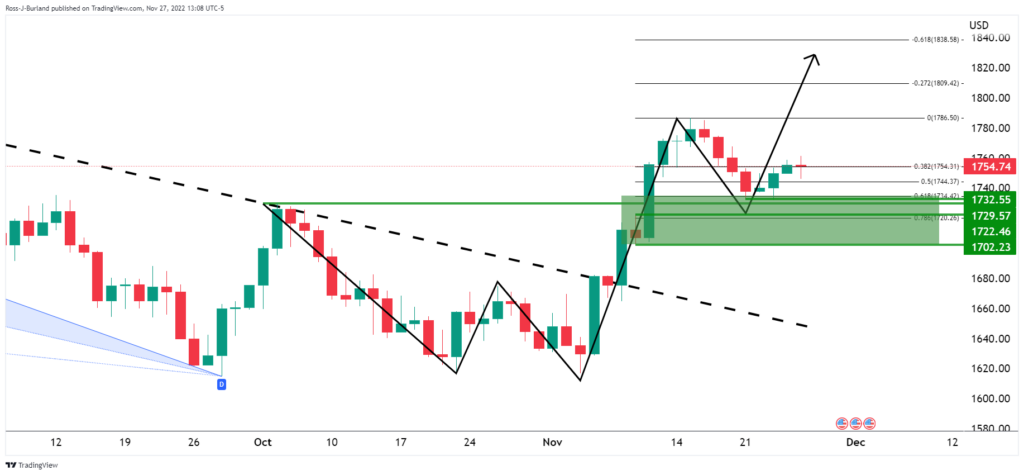 Gold prices daily chart-2
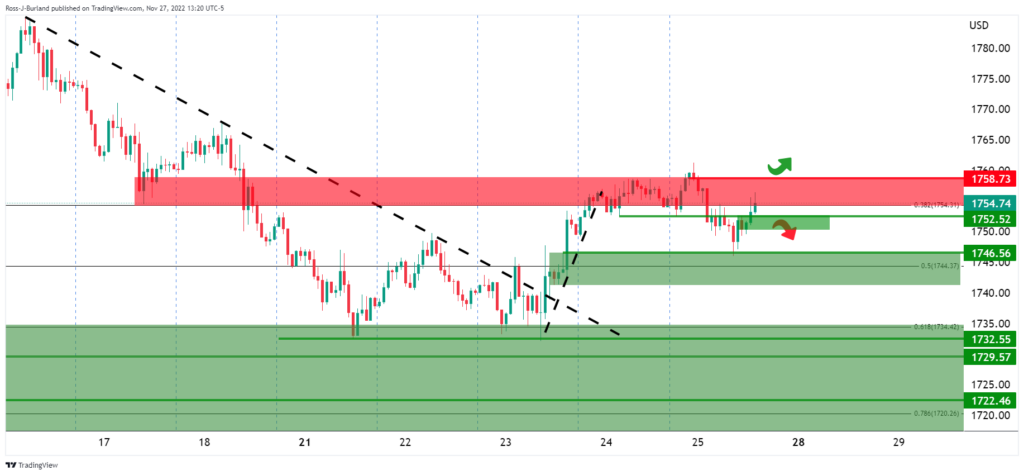
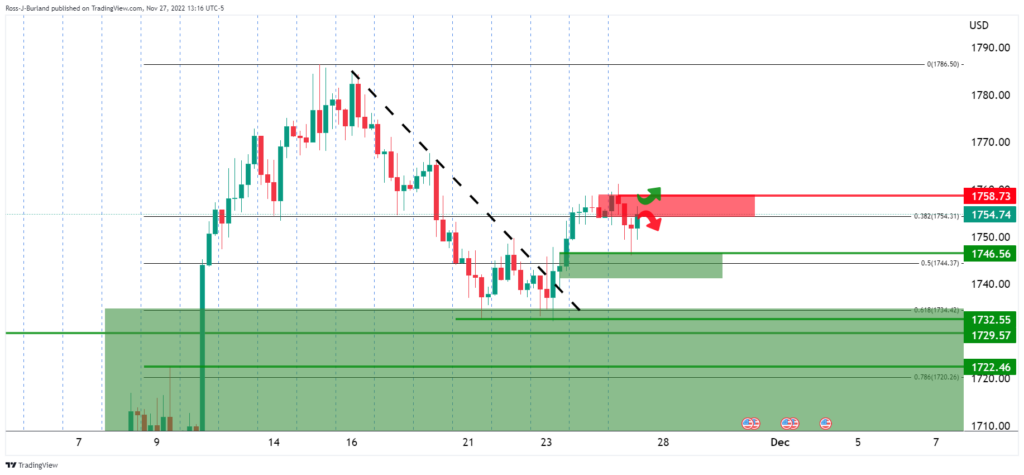 Gold prices 4-hour chart-1
The bulls must now climb above $1,758.
 Gold prices 1-hour chart
Gold prices were trading at $1,762, up 0.53% at the time of writing. U.S. gold futures rose 0.38% to $1,760.8.