According to market analyst Ross J Burland, golden bulls may be reaching a climax. Also, the bears need to push the price below $1,783 to open the risk to the downside again. We have prepared Ross J Burland’s technical analysis for gold prices for our readers.
“Money managers aggressively closed their short positions”
cryptocoin.com As you follow on , gold prices closed the week with rising on Friday. The yellow metal bounced back to $1,800, marking $1,802.18 for the day. So the golden bears refused to eat free lunch.
The market first received the crucial July US CPI data. In addition, expectations have risen that it is seeing the worst inflation ever. According to TD Securities analysts, these developments have prompted money managers to aggressively close their short positions ahead of higher gold prices.
Gold prices technical analysis
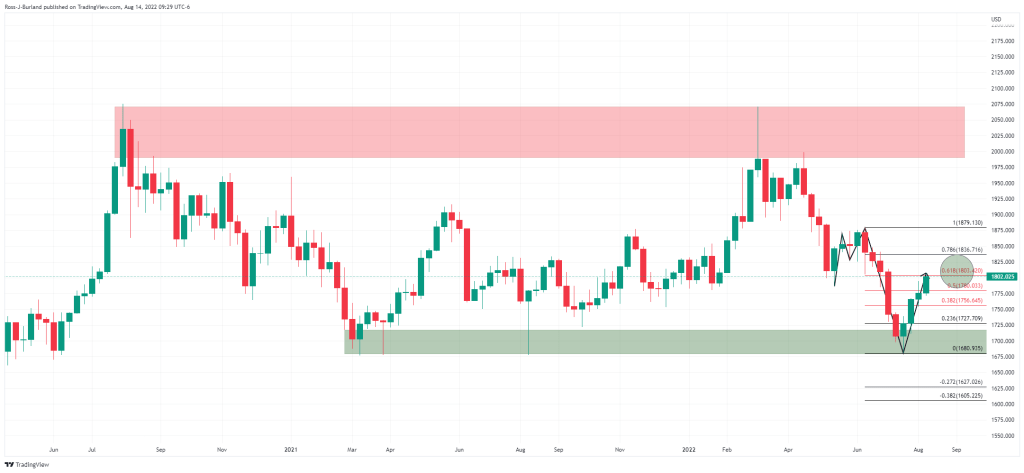
The weekly chart shows that the bulls are pushing the incoming 61.8% gold rate to not only meet the neckline of the M-formation, but to reduce a price imbalance during the previous downtrend on the weekly and daily chart.
 gold weekly chart
The gray area on the chart was an area of significant imbalance that attracted the bulls. But here we are at a crossroads.
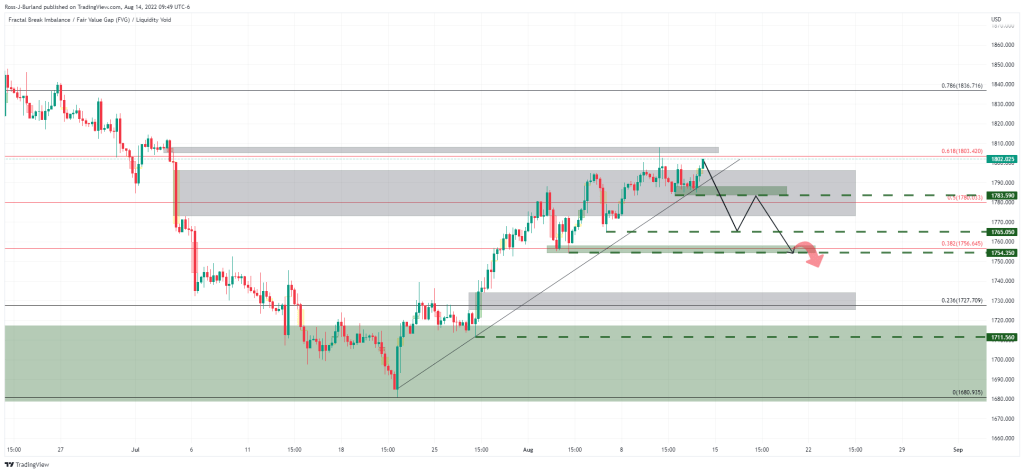
 gold daily chart
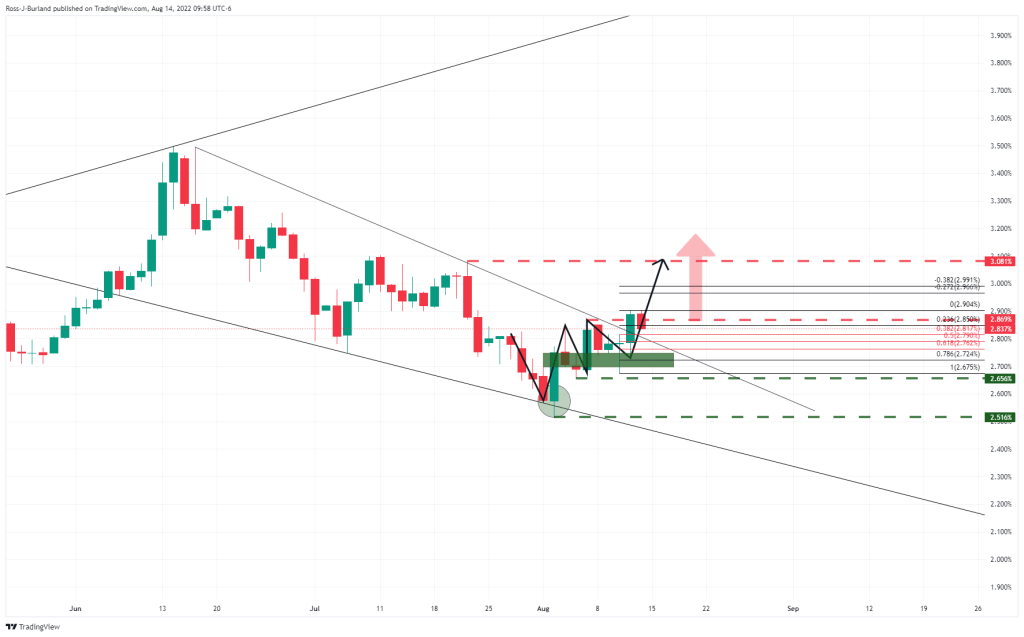
The fix is likely to be at this point. If the bears commit, traders will look for signs of top formation throughout their timeframe. A drop below $1,783 on the 4-hour chart would be a welcome feature for the bears.
Below that, $1,765 and $1,754 are key. Also, it maintains the run to $1,730 to reduce the price imbalance protecting $1,711.
 Gold H4 chart
“Gold prices rally likely to reverse”
“As Gold continues to surpass the $1,800 level on Friday, technical specifications are likely to continue to accommodate short-term risks,” TD Securities analysts said. Meanwhile, Fed officials have sent strong messages that a return to a more dovish policy stance is unlikely unless there is strong evidence that inflation pressures are easing. Analysts make the following assessment:
It seems that specs won’t want to take on the new big ong exposure needed to support a sustained price rally. Indeed, the gold rally is likely to reverse at the first sign that rates will rise above current expectations.
Much will depend on the course of US interest rates. If the 10-year chart applies in this case, then things are looking for golden bears.