US data put pressure on the dollar and fueled the gold rally. Gold prices traded above $2,040, a 13-month high, on Friday. The journey for yellow metal seems not to be over yet, although prices have since pulled back a bit.
All available data are positive for gold
cryptocoin.com As you can follow, gold prices increased by more than 10 dollars after the increase in the US Producer Price Index and Initial Unemployment Claims in March, which came below the expectations, triggering the sales in the dollar. The shiny metal bounced from below $2,030 to $2,047, its highest level since March 2022. Attention is focused on record highs of around $2,075, the historic high.
While the Weekly Unemployment Claims report pointed to a softening in the US labor market, at the same time the Producer Price Index fell more than expected, with the annualized rate falling from 4.9% in February to 2.7% in March, the lowest since January 2021. level dropped. Economic figures dragged down US yields and triggered dollar sales. At the same time, Wall Street futures rose. Experts say the available data is all positive for gold.
Next up for gold prices is $2,070
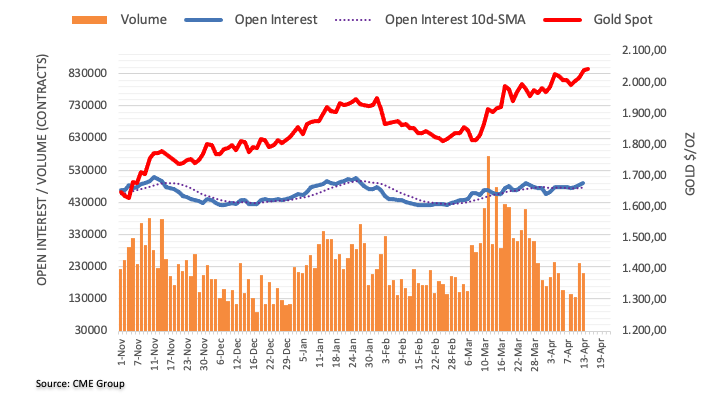
According to preliminary data from CME Group, the number of open interest in the gold futures markets increased by about 8.4K contracts in the third session on Thursday. Volume followed suit, increasing by nearly 75,000 contracts in the third session in a row.

Gold prices made a strong start to the second half of the week and reached new highs above $2,040. Market analyst Pablo Piovano notes that the rise has been driven by increased open interest and volume, showing that for now the extra gains continue. However, the next target is $2,070, which is the high of 2022 (March 8).
Gold prices technical analysis
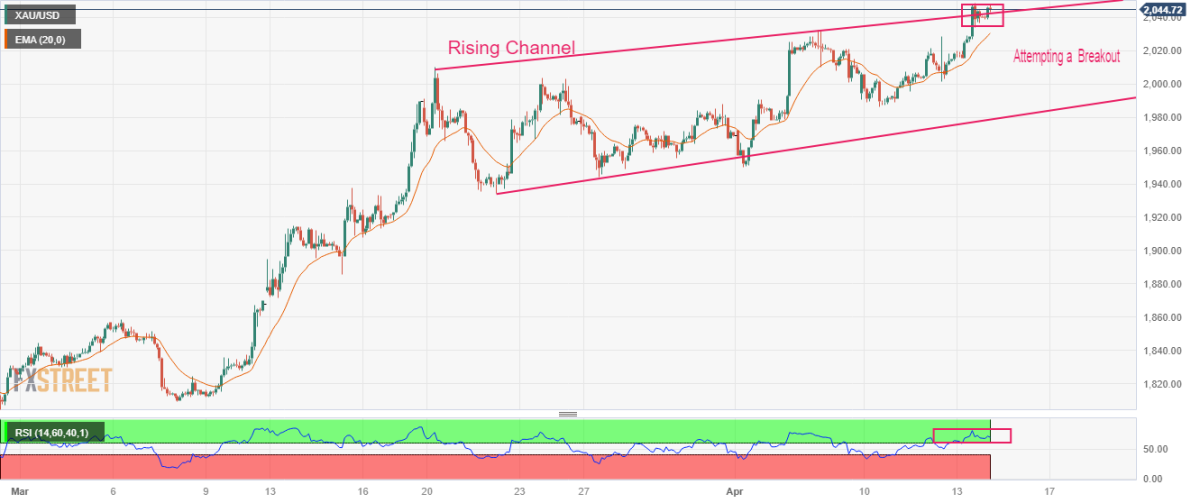
Technical analyst Sagar Dua analyzes the technical outlook for gold as follows. Gold price is gathering strength to hit the critical $2,050.00 resistance in the Asian session. The precious metal is looking to continue its upward journey after slight exhaustion in the upside momentum.
 Gold price 2 hour chart
Gold prices are auctioned in the Ascending Channel chart pattern on a two-hour scale, where each pullback is used by market participants to create new long positions. The yellow metal is consolidating near the breakout zone of the chart pattern mentioned above. The advance of the 20-period Exponential Moving Average (EMA) at $2,031.00 supports further bullishness for the gold bulls. The Relative Strength Index (RSI) (14) is swinging in the 60.00-80.00 bullish range, indicating that the upside momentum is already active.


