
Bitcoin (BTC) price looks more bearish, according to crypto analyst Rakesh Upadhyay. However, the analyst says that this could offer trading opportunities in altcoin projects such as Polygon (MATIC), Cosmos (ATOM), Monero (XMR), and Chiliz (CHZ). The analyst examines 5 cryptocurrencies that look strong on the charts.
An overview of the cryptocurrency market
cryptocoin.com As you follow, US stock markets fell on August 26 after Fed Chairman Jerome Powell’s speech reiterated the central bank’s hawkish stance. Bitcoin (BTC) and altcoin markets, which continue to correlate with the equity market, also witnessed a sharp drop on August 26. Bitcoin is down about 14% this month. Thus, it was the worst performance for August since 2015, when the price fell 18.67%. It has a dubious record, with an average loss of 6% since September 2013, according to CoinGlass data. So this is probably bad news for investors.
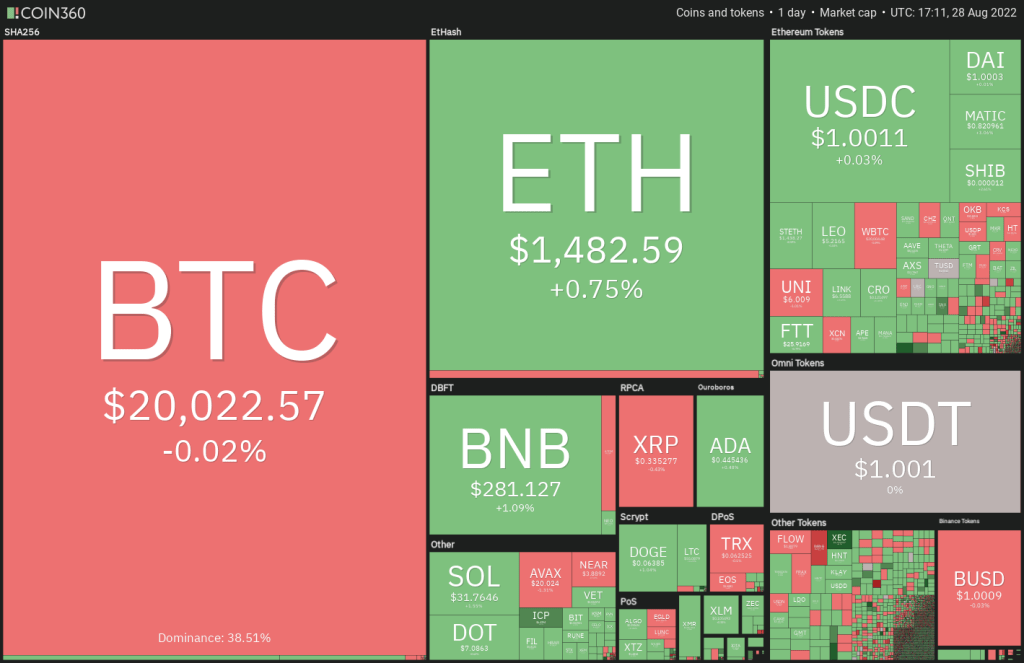 Daily view of crypto market data / Source: Coin360
Buying in a falling market is not a good strategy. However, traders can keep a close eye on cryptocurrencies that outperform the markets. Because in case of any comeback they are probably the first to leave the block. In a bear market, the trader needs to be patient. Because once the market stabilizes, they will likely find many opportunities to buy. Now it’s time for analysis…
Leading crypto Bitcoin (BTC) first
A weak rebound from a strong support indicates that the bulls are hesitant to buy aggressively at the level. The bulls successfully defended the support line for several days. However, they were unable to push the price above the 20-day exponential moving average ($21,806). This indicates a lack of demand at higher levels.
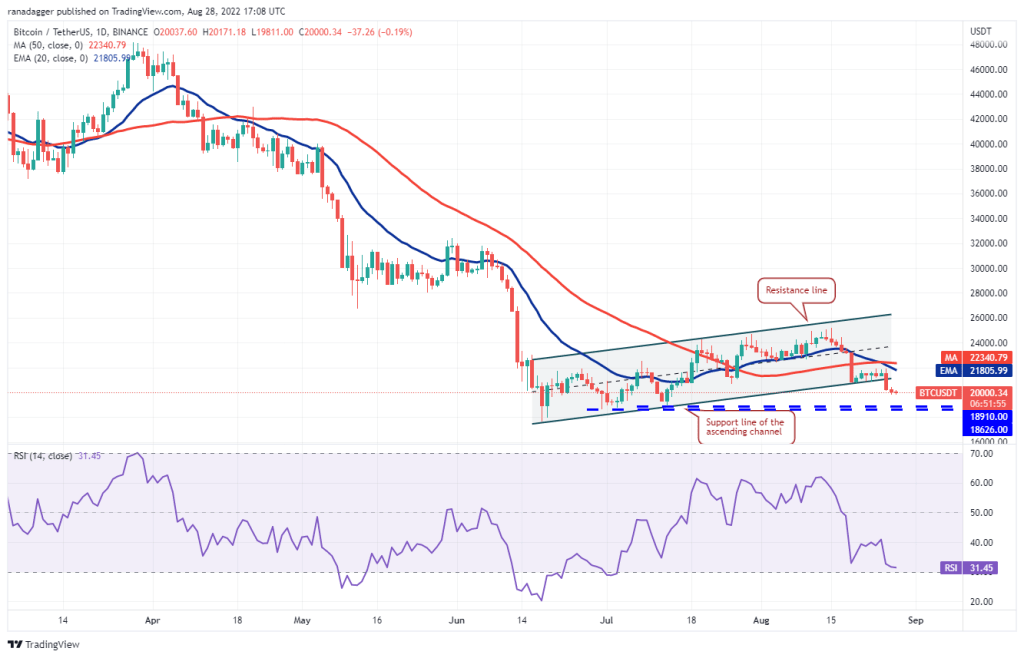
The bears seized the opportunity and dragged the price below the ascending channel on August 26. The 20-day EMA is sloping down and the RSI is near the oversold zone. This indicates that the bears are firmly in the driver’s seat. It is possible for BTC to drop into the strong support zone between $18,910 and $18,626. If the price bounces back from this zone, the bulls will try to push the price above the 50-day simple moving average ($22,340). If they do, BTC is likely to rally to $25,211.
Conversely, if the price dips below $18,626, BTC will likely retest the June 18 intraday low of $17,622. The bears will have to push the price below this level to signal the resumption of the downtrend.
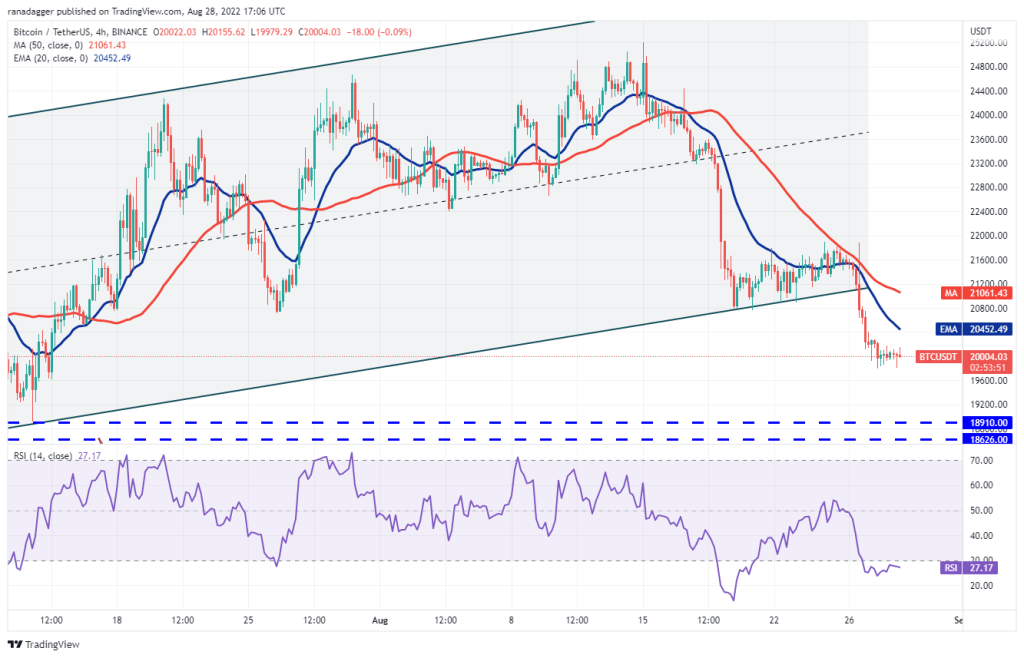
The moving averages descending on the 4-hour chart show that bears dominate. However, the positive divergence in the relative strength index (RSI) indicates that selling pressure may decrease. The first sign of strength will be an increase above the 20-EMA. If this happens, it is possible for BTC to rise to the 50-SMA. A break above this level will likely signal the end of the correction. On the contrary, selling is likely to pick up momentum if the price drops below $19,800. In this case, it is possible for BTC to drop to the $18,910 and $18,626 region.
First altcoin project Polygon (MATIC)
Polygon backfired from its strong support. This shows that the bulls are defending the level aggressively. This increases the likelihood that the range-bound action will continue for a few more days. This is one of the reasons to focus on this altcoin project.
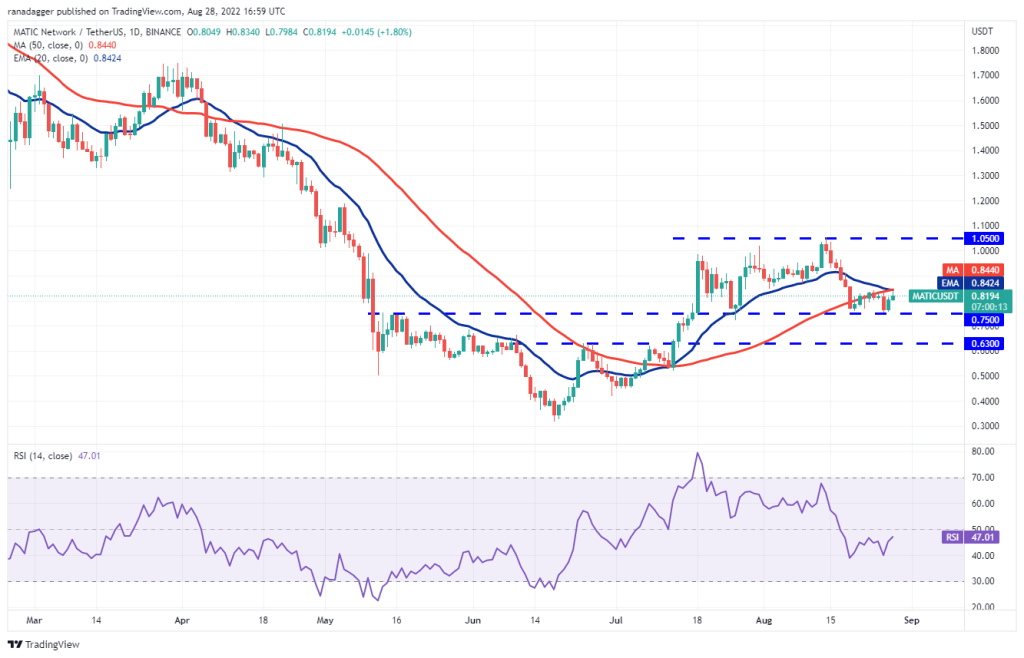
The bulls are trying to push the price above the moving averages. If they can achieve this, it will suggest that MATIC will attempt a rally towards the overhead resistance at $1.05. This level is likely to attract strong selling by the bears. Alternatively, if the price drops from the moving averages, it will indicate that the bears are selling on the rallies. The bears will then attempt to push the price below the critical support at $0.75. If they are successful, the altcoin will likely drop to $0.63.
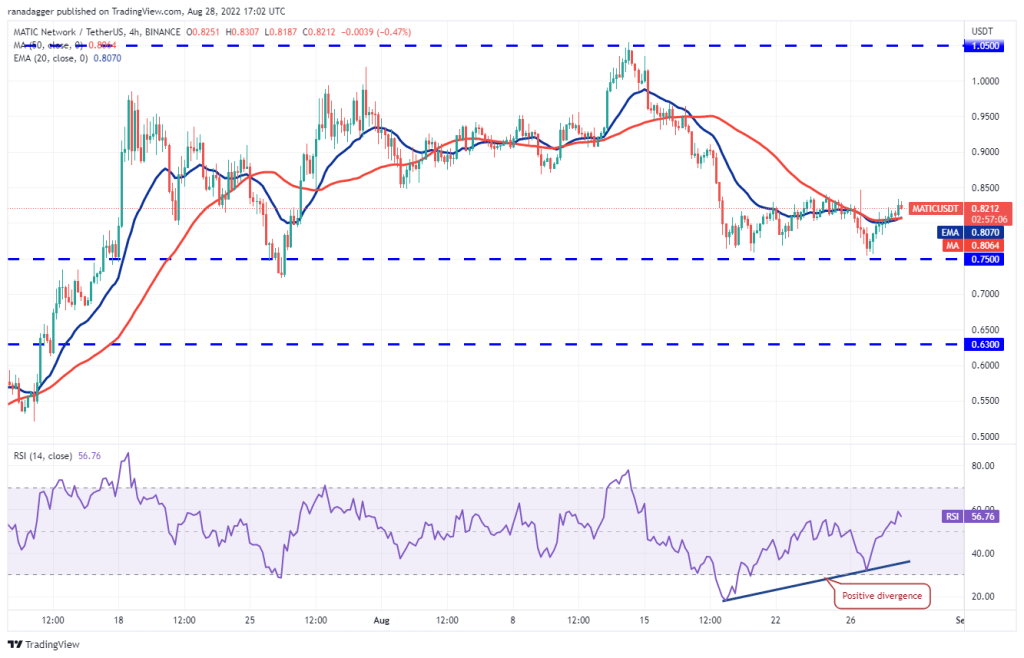
The bulls pushed the price above the moving averages. This is the first indication that the selling pressure may decrease. Another positive sign is that the RSI has made a positive divergence. This is a sign that the bears may be losing control. Buyers will try to push the price above the overhead resistance at $0.84. If successful, the altcoin will likely rise to $0.91. Also, this is likely to act as a strong resistance again. To invalidate this positive view, the bears will need to push the price below $0.75.
Second place is Cosmos (ATOM)
We chose Cosmos as it is trading above the 50-day SMA ($10.58) and close to psychological support at $10.
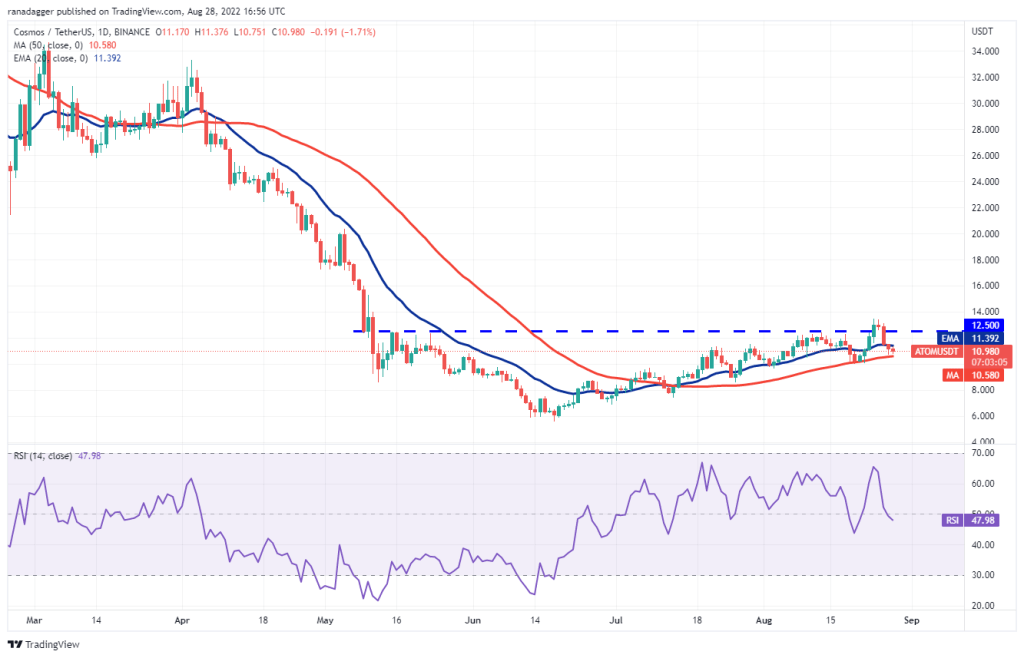
The bulls are expected to aggressively defend the zone between $10 and the 50-day SMA. If the price bounces back from this zone and rises above the 20-day EMA ($11.39), it will indicate that selling pressure may decrease. It is possible for ATOM to later rally to the overhead resistance at $12.50 and then to $13.45. A break above this level will likely signal the end of the downtrend. Contrary to this assumption, if the price drops and dips below the support zone, a deeper correction is likely to begin. ATOM is likely to drop to $8.50 later.
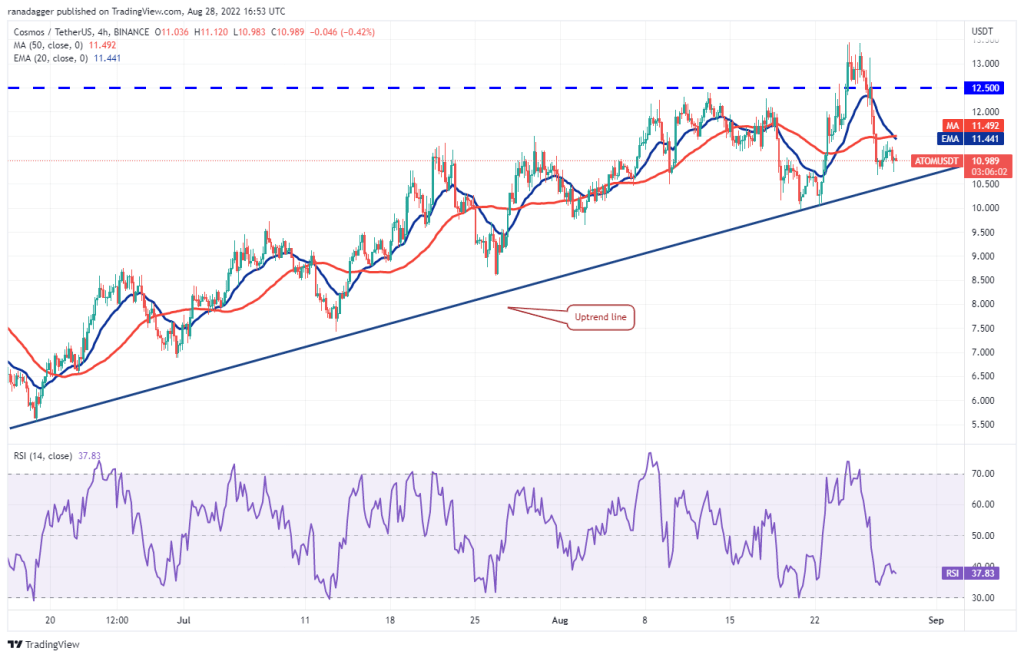
The 20-EMA is down on the 4-hours chart and the RSI is in the negative territory. This shows that the bears are advantageous in the near term. Sellers will have to push and sustain the price below the bullish line to challenge the psychological support at $10. Conversely, if the price breaks out of the uptrend line, it will indicate that the bulls are buying the dips to this level as in the previous cases. Buyers will have to push the price above the moving averages to open the doors for a possible rally to $12.50.
Third-ranked altcoin project Monero (XMR)
Monero topped the list as it held above the immediate support at $142. This suggests that lower levels are attracting buyers.
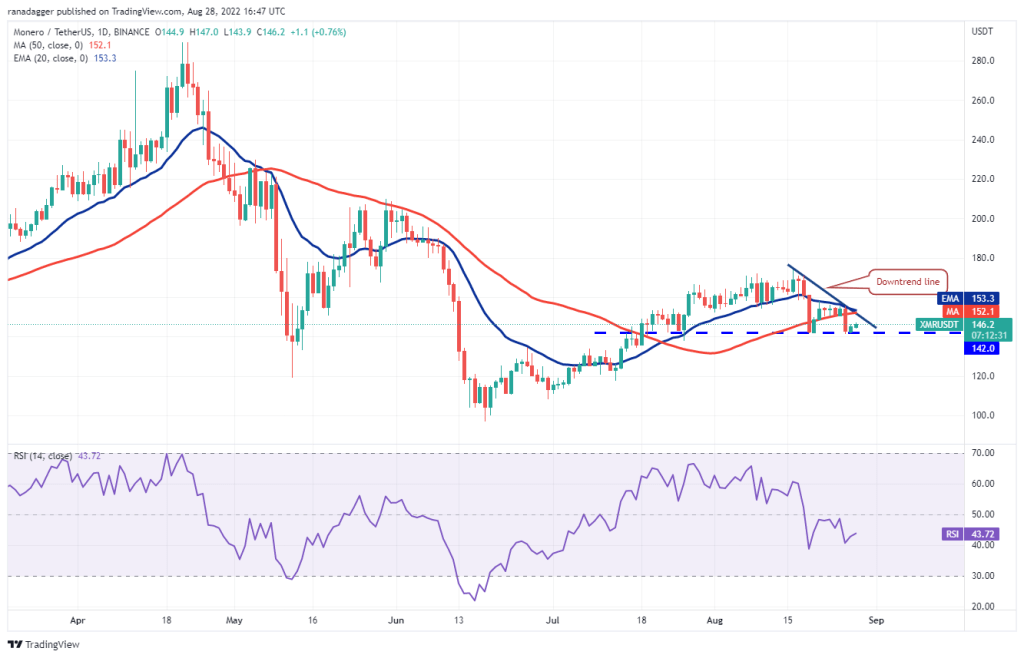
If the bulls push the price above the 20-day EMA ($153), it indicates that the correction is over. The altcoin will likely pick up momentum if the bulls push the price above the overhead resistance at $158. If this happens, it is possible for XMR to rally to $174. The bulls will have to break through this hurdle to signal the resumption of the upward move. This positive sentiment could be invalidated in the short term if the price declines and settles below the strong support at $142. If this happens, XMR is likely to drop to $132 and then $117. The falling 20-day EMA and RSI in the negative zone suggest that the bears have a slight advantage.
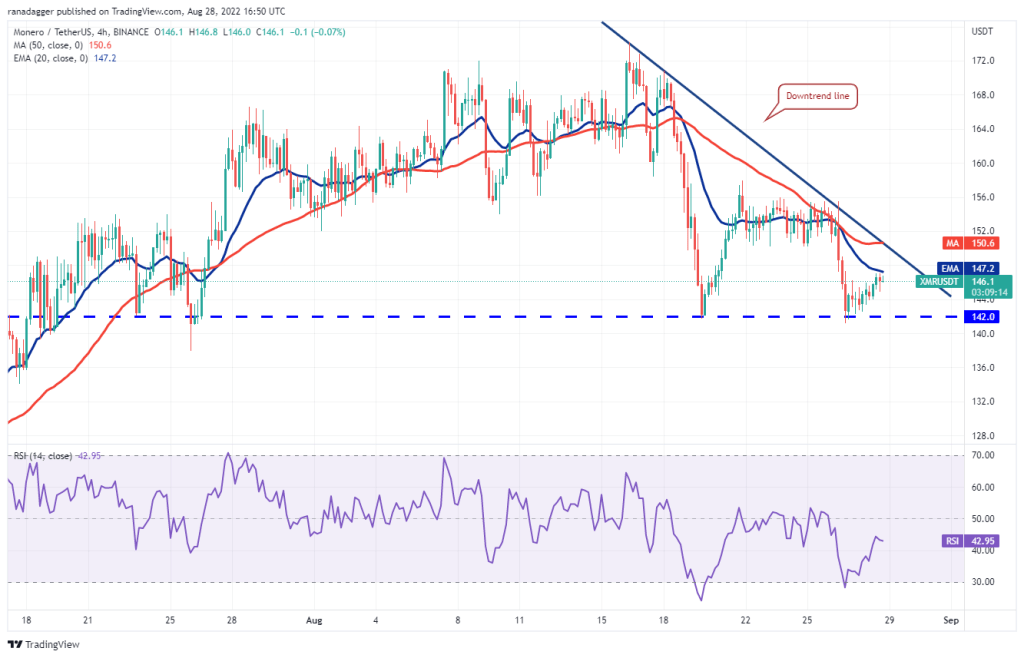
Buyers are trying to push the price above the 20-EMA. If they manage to do so, it is possible for XMR to rise to the 50-SMA, which will act as stiff resistance again. If the bulls break this hurdle, XMR is likely to rise to $158. A break and close above this resistance will signal a shift in the short-term trend. Conversely, if the price drops from the 20-EMA, it will show that the bears are selling on minor rallies. XMR is likely to drop to the strong support at $142 later. If this support is broken, it will suggest the start of a deeper correction.
Latest altcoin project Chiliz (CHZ)
Chiliz found a place on this list for the third week in a row. This is because it remains in an uptrend even after the last correction.
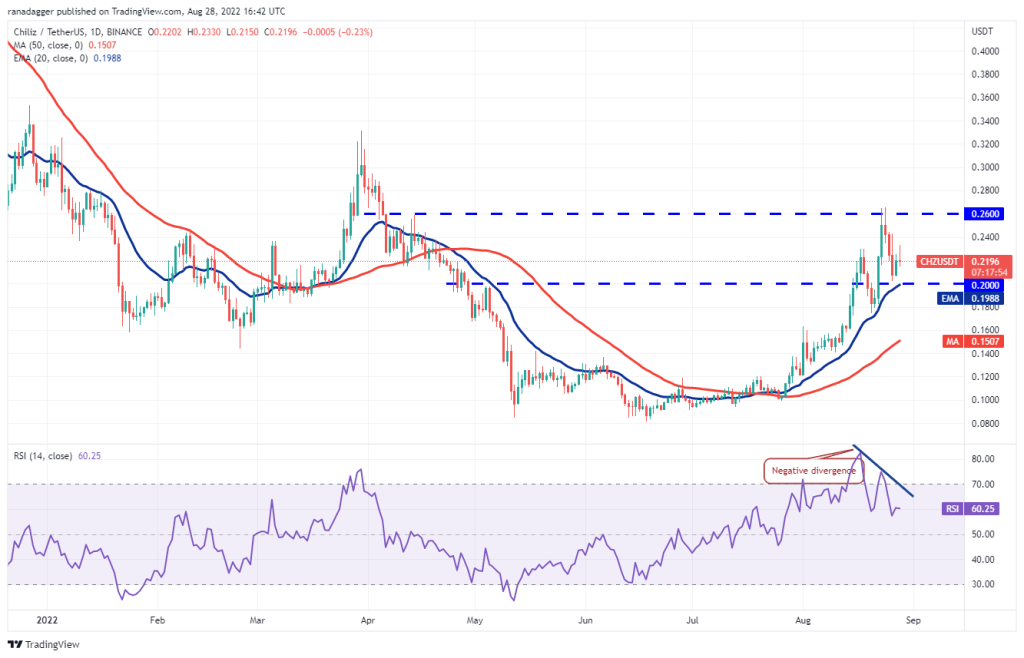
Buyers pushed the price above the overhead resistance of $0.26 on August 23 and August 24. However, they failed to sustain higher levels as seen by the long wicks on the candlesticks. This likely encouraged short-term investors to book profits. This brought the price down to the $0.20 breakout level, which is just above the 20-day EMA ($0.20).
The bulls bought this drop and are attempting to continue the upward move towards the overhead resistance at $0.26. The bulls will have to break through this hurdle to open the doors for a possible rally to $0.33. Rising moving averages give buyers an edge. However, the negative divergence in the RSI signals that the bullish momentum may weaken. If the price drops and dips below the 20-day EMA, the advantage will turn in favor of the bears. A further drop to the 50-day SMA ($0.15) is possible for CHZ.
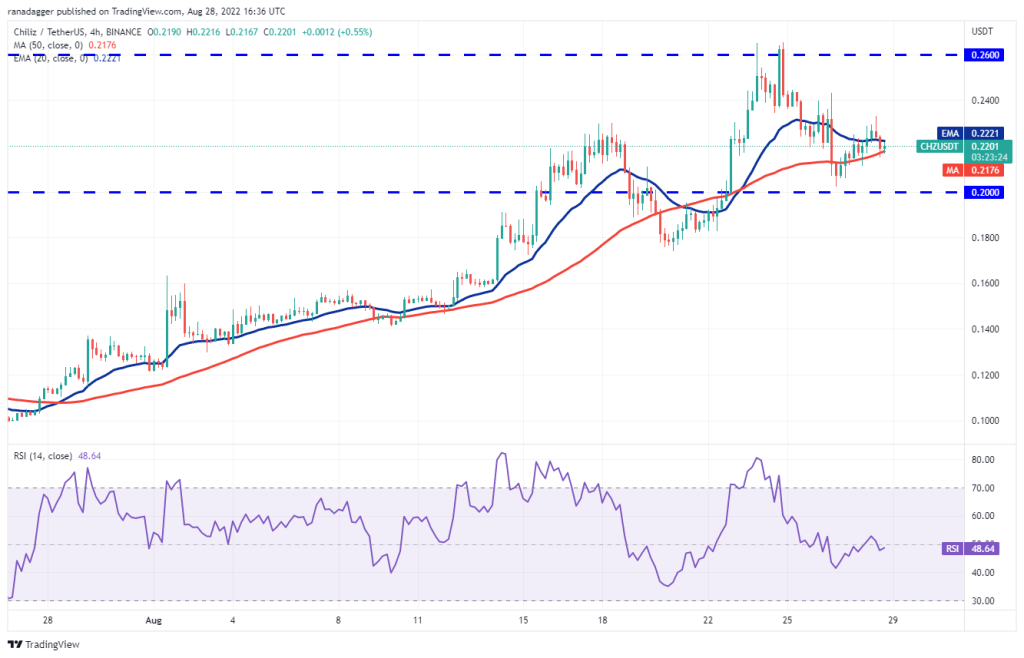
The 20-EMA on the 4-hour chart is flattening and the RSI is fluctuating near the midpoint. This shows that there is a balance between buyers and sellers. This will likely keep CHZ between $0.20 and $0.26 for a while. The next trend move is possible if the bulls sustain the price above $0.26 or below $0.20. Until then, the bulls are likely to take the support dips at $0.20 and sell near the overhead resistance at $0.26. Trading in the range will likely remain volatile and random.


