Bitcoin managed to propel its recovery above $24,000 for a short time. Thus, altcoins continued to post smart gains on July 20. However, the week’s bullish momentum took a short break after Tesla’s earnings report showed the company sold 75% of its BTC position. This week’s sharp breakout has been a positive sign. However, analysts point out that the rapid recovery is dependent on Wall Street’s strong performance. Analyst Venturefounder said the rally was largely macro-focused. He also pointed out that Bitcoin’s correlation with the NASDAQ remains at a historical high of 91%.
Bitcoin’s sharp rally over the past few days has awakened hibernating bulls. Analyst TechDev predicts a target of $120,000 for BTC price in 2023. Galaxy Digital CEO Mike Novogratz spoke to a Bloomberg conference on July 19. Accordingly, Novogratz said that Bitcoin could rise above $500,000 in the next five years. However, analysts are divided on their near-term expectations. Some are not convinced that the trend is back to bullish. These investors say the current rise is a bear market rally. On the other hand, some analysts expect the uptrend to continue in the short term. On-chain data company Whalemap suggests that the rally could extend to $27,100.
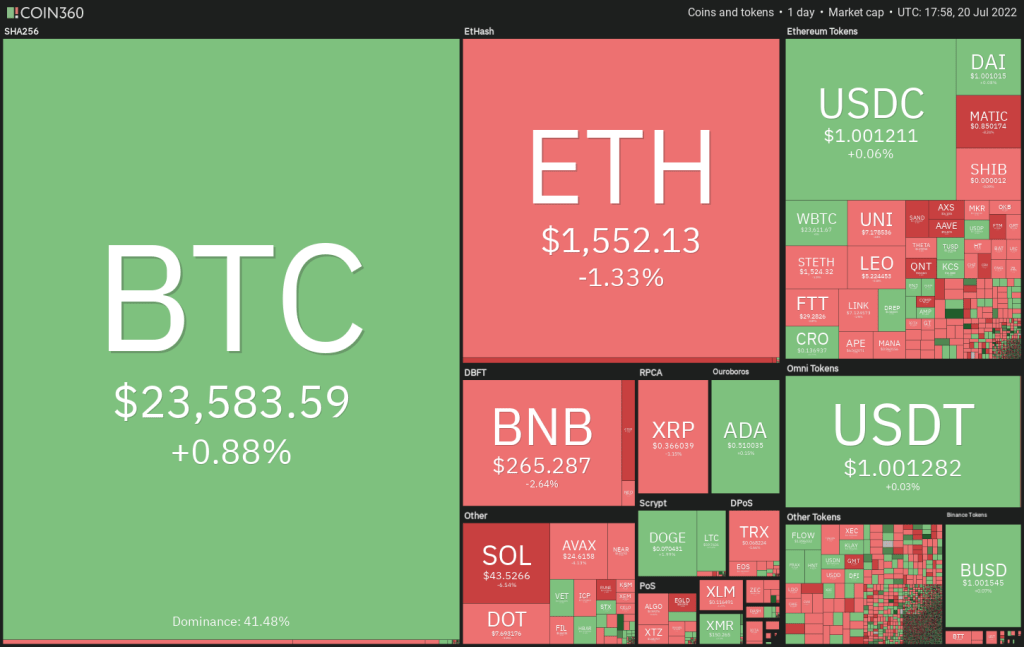
Levels to follow for BTC, DOGE and 7 altcoins
Will BTC and major altcoins continue to rise or will the bears trap the bulls and drive the price down? Let’s explore the analysis of the top 10 cryptocurrencies to find out. cryptocoin.comWe have compiled it for you.
Bitcoin (BTC)
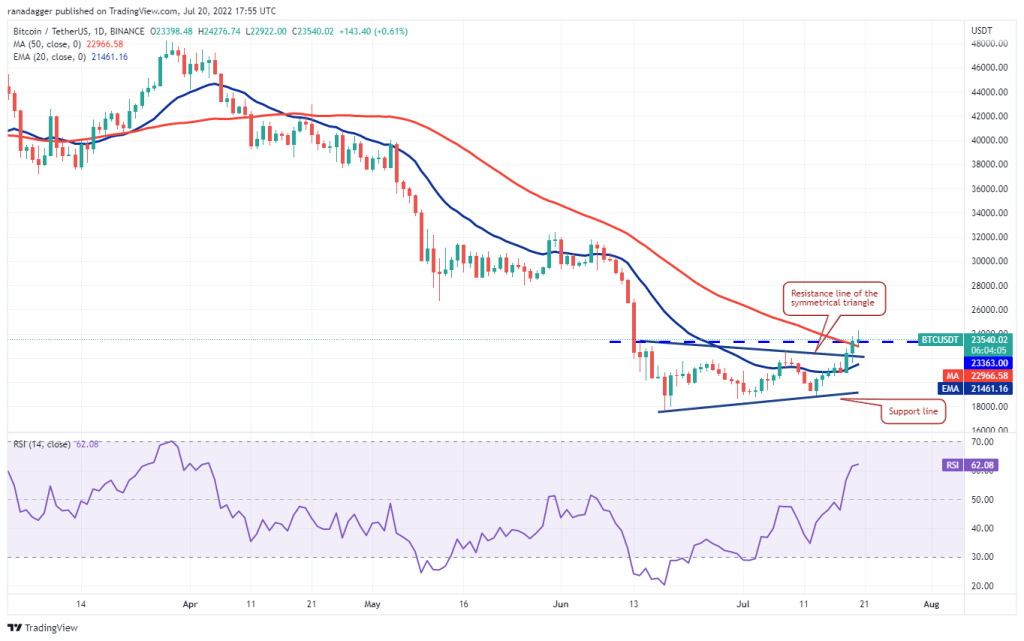
Bitcoin broke above the 50-day simple moving average ($22,966) on July 19. Besides, the overhead resistance closed above $23,363. Accordingly, the indicators point to a potential trend change. It is possible for buyers to keep the price above $23,363. In this case, the bullish momentum will increase even more. Thus, the BTC/USDT pair will attempt to rise to the $28,171 pattern target. This level has the potential to witness profit booking from short-term traders. The 20-day exponential moving average (EMA) ($21,461) has started to rise. Additionally, the relative strength index (RSI) has moved up into positive territory. So these indicators reveal an advantage for buyers. It’s up to the bears to override this positive opinion. The bears will need to push the Bitcoin price below the 20-day EMA. If they do, it will show that the final breakout could be a bull trap.
Ethereum (ETH)
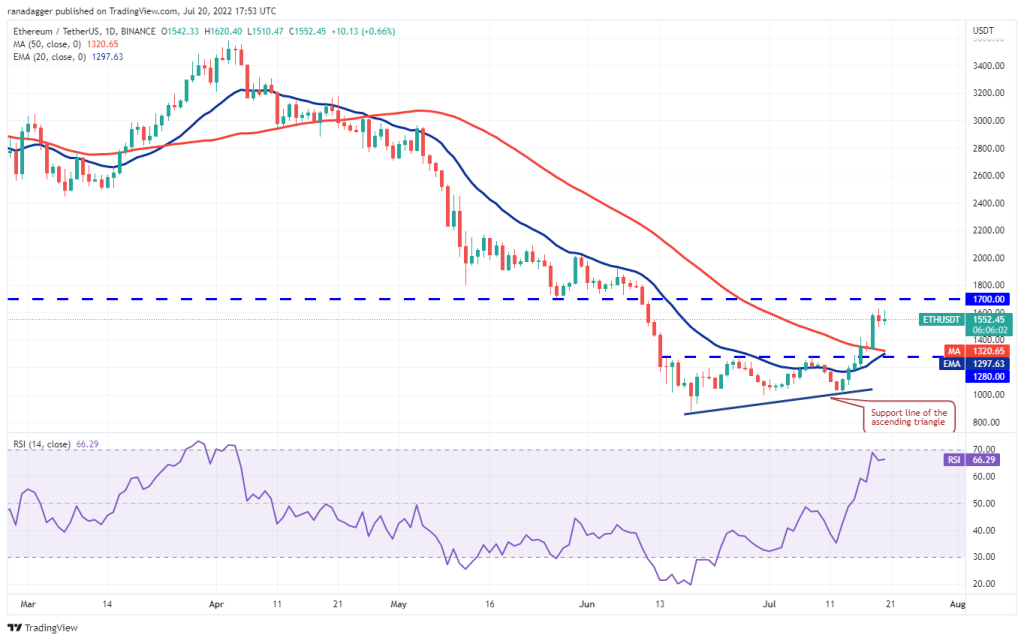
Ethereum (ETH) recovery approaches strong overhead resistance at $1,700. The bears tried to push the price down on July 19. But the bulls did not give up. This suggests that investors are not aggressively allocating profits as they expect a higher move. The moving averages have completed the bullish crossover. Also, the RSI is moving close to the overbought zone. This indicates that the path of least resistance is up. It is possible for buyers to push the price above $1,700. In this case, the ETH/USDT pair will target the psychological level of $2,000. Then, they will try to rise to $2,200. Contrary to this assumption, the price is likely to drop from $1,700. Accordingly, if ETH breaks below $1,493, the bears will try to push the price towards $1,280. The two leading cryptocurrencies, ETH and BTC, seem to show bullish potential.
Binance Coin (BNB)
BNB relief rally is approaching a downtrend line with potential to act as minor resistance. The moving averages have completed the bullish crossover. Additionally, the RSI is close to the overbought zone, indicating an advantage for buyers. The price has the potential to go down from the current level or downtrend line. In this case, the BNB/USDT pair will correct to the 20-day EMA ($244). So this is an important level to consider. A bounce from the aforementioned level indicates that the bulls are buying on the lows. This will increase the likelihood of the downtrend line breaking. If this happens, the pair will have upside potential to $300 and then to $350. Contrary to this assumption, the price is likely to fall below the moving averages. If this happens, it will indicate that sentiment is bearish and traders are selling on rallies.

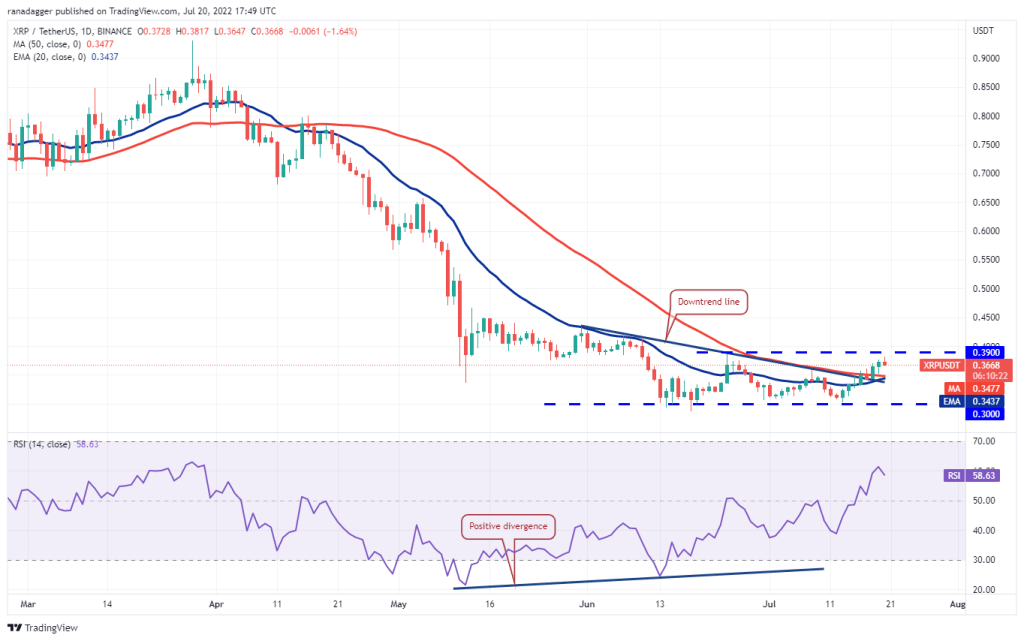
Ripple (XRP)
A relief rally in Ripple (XRP) is possible to face overhead resistance at $0.39. The bears are trying to push the price below the moving averages. If the XRP/USDT pair bounces off the moving averages, it indicates that the sentiment has turned positive and traders are buying on the dips. The bulls will then make another attempt to break the overhead barrier and push the price towards $0.45. This level will cause the bears to sell strongly again. If XRP breaks below the moving averages, the positive outlook will be invalidated in the short term. If this happens, the pair will visit vital support at $0.30 again.
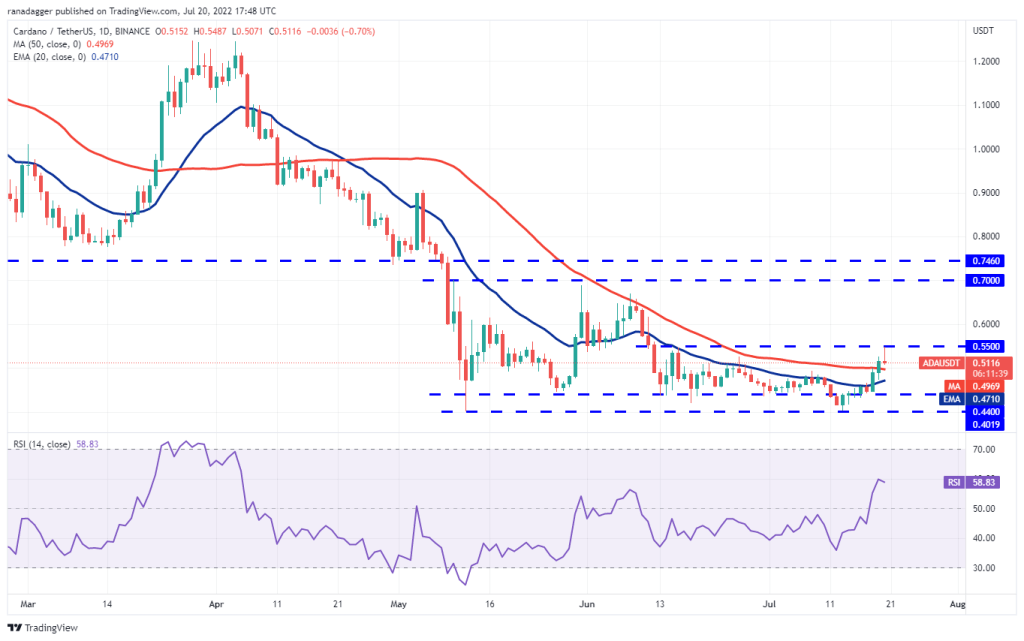
Cardano (ADA)
The bears tried to stop Cardano (ADA) from recovering near the 50-day SMA ($0.50). However, the bulls had other plans. They bought the drop to the 20-day EMA ($0.47). Thus, they managed to push the price above the overhead resistance. The upside met resistance at $0.55, which is likely to pull the ADA/USDT pair to the 20-day EMA. The slowly rising 20-day EMA and RSI in the positive zone point to the advantage for buyers. The price has the potential to bounce back from the 20-day EMA. In this case, the bulls will again try to break through the general barrier. If successful, the rally is likely to reach $0.62. Another possibility is that the price will drop from the current level. In this case, Cardano will stay in the $0.44 to $0.55 range for a few days. Cardano displays a similar chart with BTC.
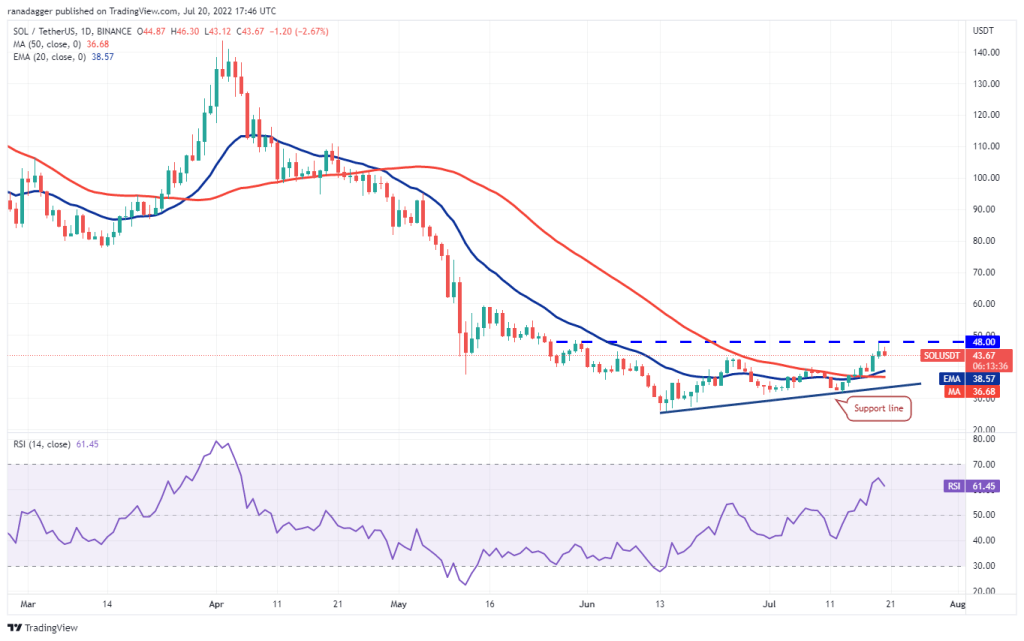
Left (LEFT)
Solana’s (SOL) recovery faces resistance at $48. This resistance was revealed by the long candlestick on the July 19 candlestick. Accordingly, it indicates that the bears continue to sell at higher levels. If the bulls don’t leave much room for the bears, a break above the overhead resistance will increase the chances. The slowly rising 20-day EMA ($38) and the RSI in the positive zone are giving buyers an edge. A break and close above $48 will open the doors for a possible rally to $60. Contrary to this assumption, it is possible for the price to drop sharply from the current level. So, should this happen, the SOL/USDT pair will fall back to the moving averages. The bears will have to sink the pair below the support line to gain the upper hand on Solana.
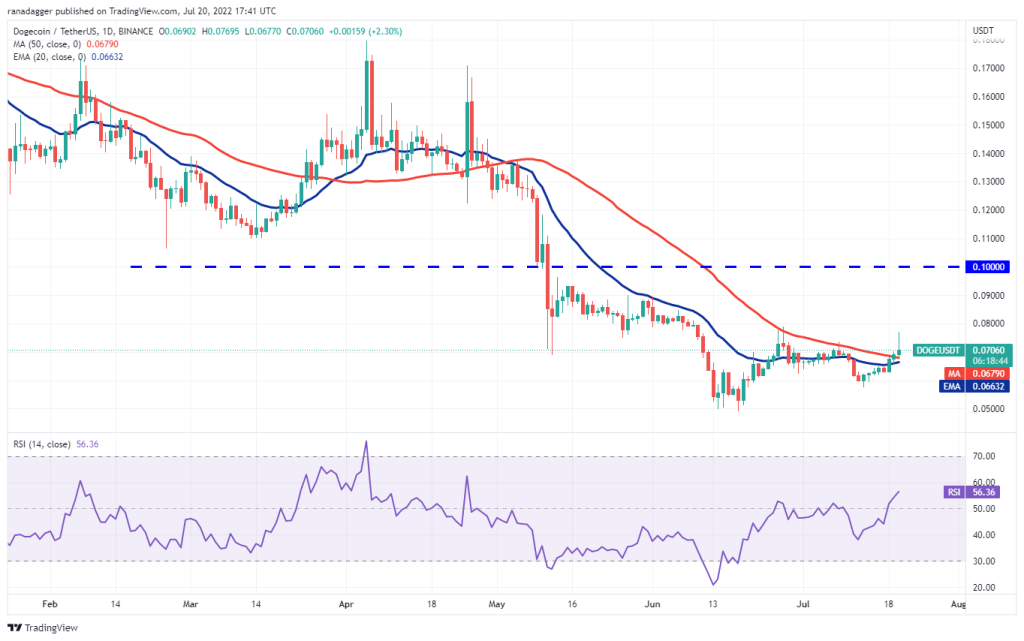
Dogecoin (DOGE)
Dogecoin (DOGE) broke above the 50-day SMA ($0.07) and closed on July 19. However, the rally is facing resistance near $0.08 as seen from the long bar on the July 20 candlestick. The moving averages are on the verge of a bullish crossover and the RSI is in the positive zone. Therefore, key indicators are showing that the bulls have the upper hand. The price has the potential to bounce back from the 20-day EMA ($0.06). In this case, the bulls will again try to clear the overhead barrier at $0.08. Also, they will push the Dogecoin price to $0.10. Alternatively, the pair will drop to $0.06 if the price drops below the moving averages. A bounce from this level has the potential to keep the pair in the $0.06 to $0.08 range for a few days.
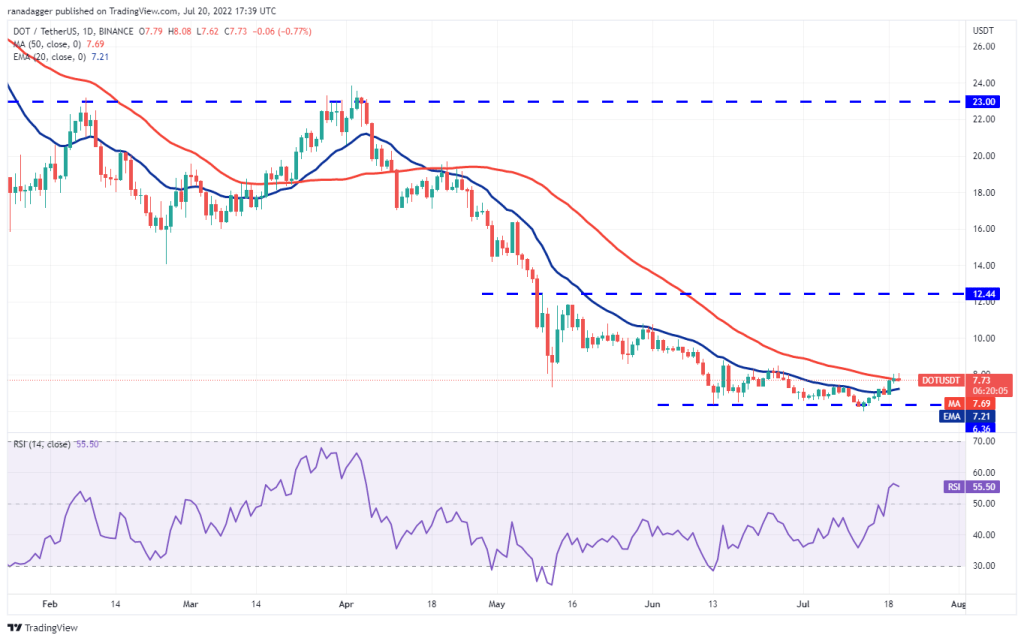
Polkadot (DOT)
Polkadot’s (DOT) rally reached the 50-day SMA ($7.73) on July 18. However, the bulls are struggling to overcome this hurdle. This indicates that the bears are aggressively defending this level. The 20-day EMA ($7.21) is flat and the RSI is in the positive zone. So they show a small advantage for buyers. If the price breaks from the current level and bounces back from the 20-day EMA, it indicates that the dips are bought. The bulls will then try to push the price towards $10. This positive view will be invalidated in the short term if the price drops below the 20-day EMA. Also, Polkadot price has the potential to bounce back to important support at $6.36.
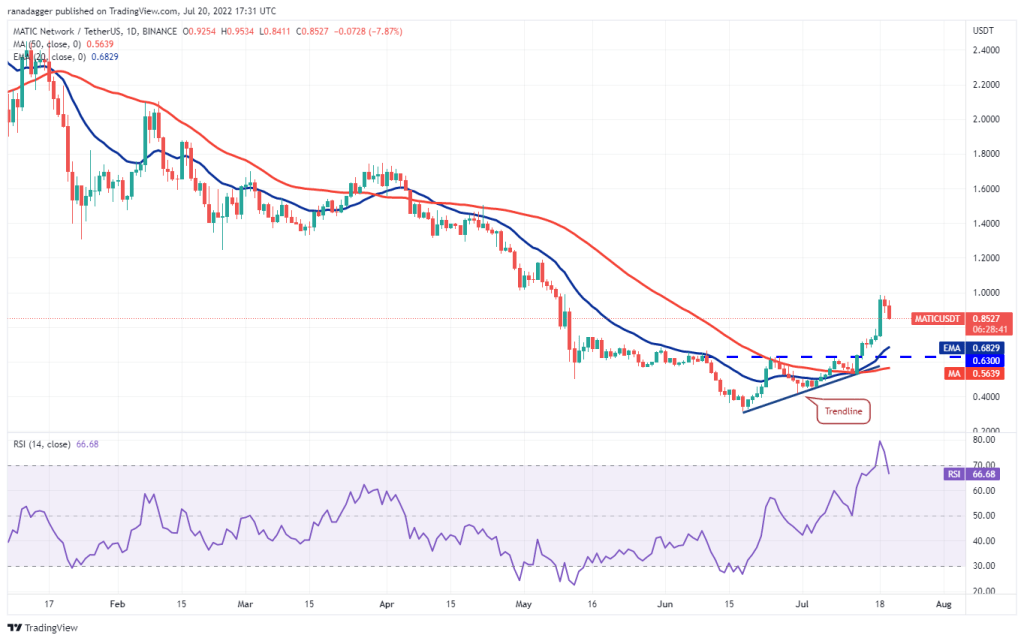
Polygon (MATIC)
The upside action of Polygon (MATIC) over the past few days has pushed the RSI into the overbought territory. So the RSI reveals the possibility of the rally overheating in the short term. This may have attracted profit booking close to the $1 psychological level. The price has the potential to drop to the 20-day EMA ($0.68), which is likely to act as a strong support. The ascending 20-day EMA and the RSI in the positive zone indicate that the bulls have the upper hand. If the price bounces back from the 20-day EMA, it will indicate that sentiment has turned positive and the bulls are buying on the dips. The bulls will then try to push the price above $1. If successful, MATIC price is likely to rise towards the overhead resistance at $1.20. Also, a break and close below the 20-day EMA will turn the advantage in favor of the bears.
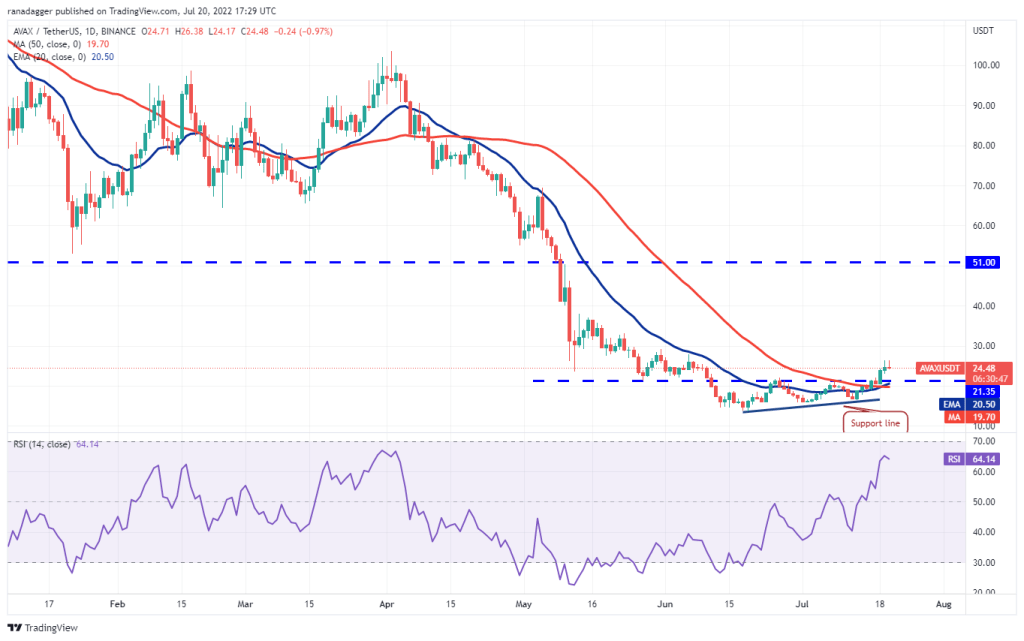
Avalanche (AVAX)
Avalanche (AVAX) broke out of the ascending triangle pattern on July 18. Thus, it indicates the beginning of a new upward movement. However, the long wick on the July 19 and 20 candlestick indicates that the bears are selling higher. Thus, it reveals that they will try to push the price towards the breakout level at $21.35. The moving averages have completed the bullish crossover and the RSI is in the positive territory, giving buyers an advantage. If Avalanche rises to $21.35, it indicates that the bulls have turned the level to support. This will lead it to resume its uptrend towards the $29 pattern target. The aforementioned positive view will be invalidated if the price drops below $21.35. Such a move would indicate that the bears continue to sell in the rallies. The pair is likely to return to support levels later. It should be noted that AVAX, like other altcoins, is correlated with BTC.