The crypto market has seen $1,800 billion disappear in the long crypto winter. Regulatory risk, inflation, recession fears and Fed monetary policy continue to be headwinds for cryptocurrency investors. According to financial markets expert Bob Mason, a bottoming dip will offer investors an opportunity to buy Binance Coin (BNB), Bitcoin (BTC), and Solana (SOL) at lower price levels. We have prepared Bob Mason’s analysis of BNB, BTC and SOL for our readers.
First of all, the leading cryptocurrency Bitcoin (BTC)
Bitcoin is the largest cryptocurrency by market cap and attracts the attention of individual and institutional investors. Importantly, Bitcoin is not only the mainstay of the cryptocurrency market, it is also the most stable and is backed by a loyal investor base often referred to as Bitcoin whales. As you know from
Kriptokoin.com news, since reaching an all-time high of $68,979 on November 10, Bitcoin has It fell 62.5% to a current year low of $25,836. Year-to-date, Bitcoin has dropped 21% to $29,680. With the adoption of Bitcoin gaining traction in multiple jurisdictions, BTC remains the target cryptocurrency for experienced and novice investors alike.
Technical indicators for the leading cryptocurrency are currently bearish
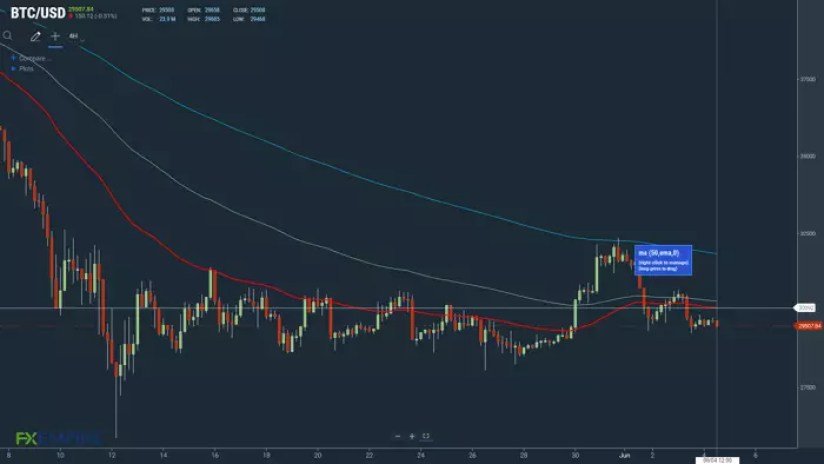
Looking at the EMAs and the 4-hour candlestick chart (below), this is a bearish signal. Bitcoin is currently sitting below the 50-day EMA of $30,092. The 50-day retracement from the 100-day EMA. The 100-day EMA has held steady against the 200-days EMA, which is BTC neutral. A move from the 100-day EMA, currently at $30,301, and a bullish trend from the 50-day EMA to the 100-day EMA would indicate a shift in sentiment.
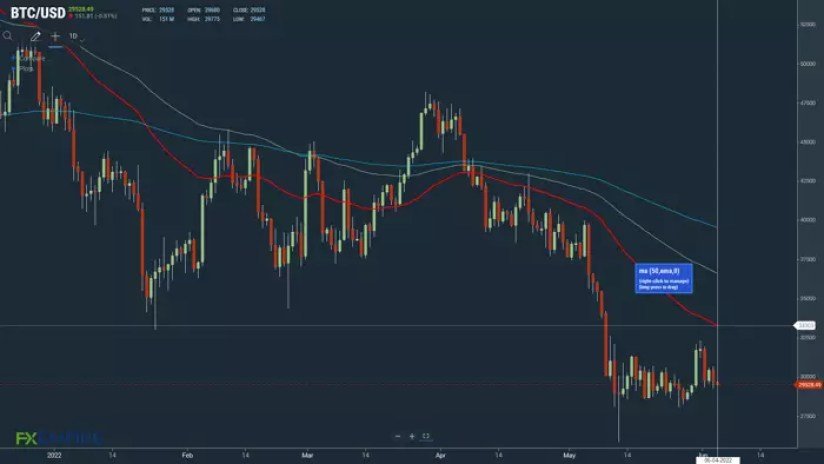
Bitcoin’s daily candlestick confirms the current bear trend. Bitcoin is currently sitting below the 50-day EMA of $33,303. The 50-day EMA retracted from the 100-day EMA and the 100-day EMA fell from the 200-day EMA; Bitcoin is negative.
A move in the 100-day EMA, currently at $36,660, could signal the end of the crypto winter and a return to $50,000.
Second place is Binance Coin (BNB)
Binance Coin is in the top five with a market capitalization of $48.8 billion cryptocurrency and native cryptocurrency of crypto exchange Binance. The world’s leading crypto exchange is in expansion mode at a time when other platforms are freezing or reducing their employee numbers.
Recently Binance received regulatory approval to offer its services in France, Italy, Dubai, Abu Dhabi and Bahrain. With trading volumes eclipsing its competitors, the exchange and its native token will likely emerge stronger from the crypto winter. Another attractive feature of Binance is BinanceChain, which is a community-driven, open-source and decentralized ecosystem. Binance Coin is the management token.

BNB offers a value proposition for investors. Since the all-time high of $693.73 on November 10, BNB fell 70% to $206.62, the current year low on May 12. Year-to-date, BNB dropped 42% on June 3 to $298.18. Technical indicators for
BNB are bearish
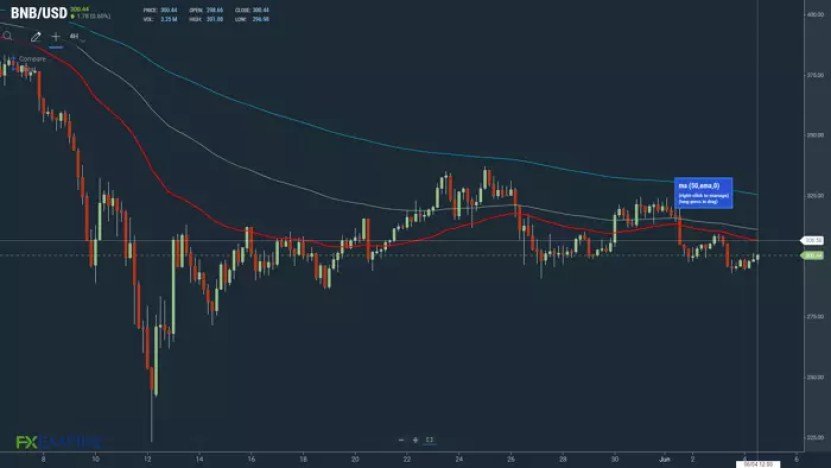
Looking at the EMAs and the 4-hour candlestick chart (below), this is a bearish signal. BNB is currently sitting below the 50-day EMA of $307. The 50-day retracement from the 100-day EMA. The 100-day EMA retracted from the 200-day EMA; BNB negative.
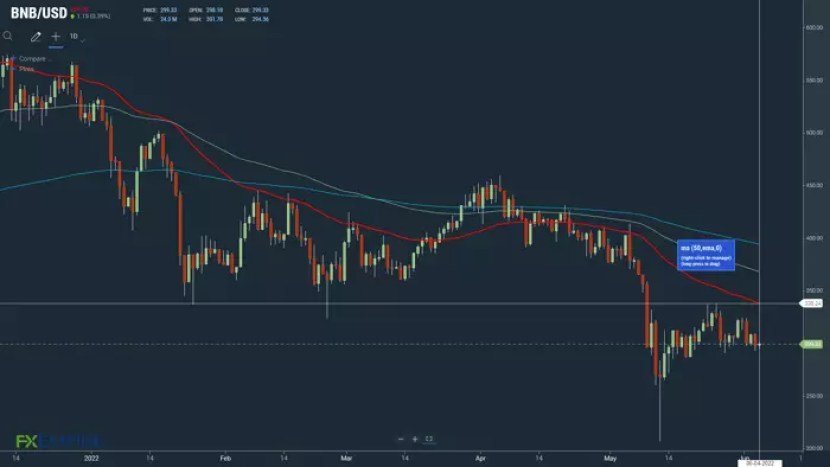
A move from the 100-day EMA, currently at $311, and a bullish trend of the 50-day EMA over the 100-day EMA would indicate a shift in sentiment. The daily candlestick chart for
BNB also confirms the current bearish trend. Binance Coin is currently sitting below the 50-day EMA of $338. The 50-day EMA retracted from the 100-day EMA and the 100-day EMA fell from the 200-day EMA; BNB negative.
A move to the 100-day EMA, currently at $368, could signal a short-term bearish trend reversal and a return to $400.
Latest coin Solana (SOL)
Solana is one of the top ten cryptos by market cap and is currently listed on CoinMarketCap with 12 It ranks ninth with a market capitalization of $.78 billion. The only Web3 in the SOL top 3, though there are other contenders including Decentraland (MANA) and The Sandbox (SAND).
Low transaction fees and its established presence in the Web3 space make SOL a viable alternative to Ethereum (ETH). Also, an ecosystem with many new projects and demand from DeFi investors add to SOL’s appeal.
As with the previous two cryptos, Solana has seen heavy losses since peaking in 2021. Solana fell 86% from an all-time high of $259.95 on Nov. 6 to a low of $35.72 from June 4th. Year-to-date, Solana fell 78% to $38.23 on June 3. Technical indicators for
SOL are bearish for now
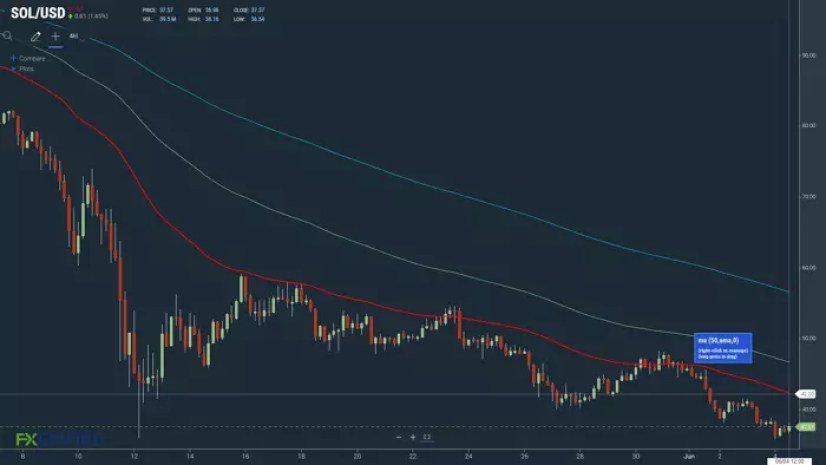
Looking at the EMAs and the 4-hour candlestick chart (below), this is a bearish signal. The SOL sits below the 50-day EMA, which is currently $42. The 50-day retracement from the 100-day EMA. The 100-day EMA retracted from the 200-day EMA; LEFT is negative.
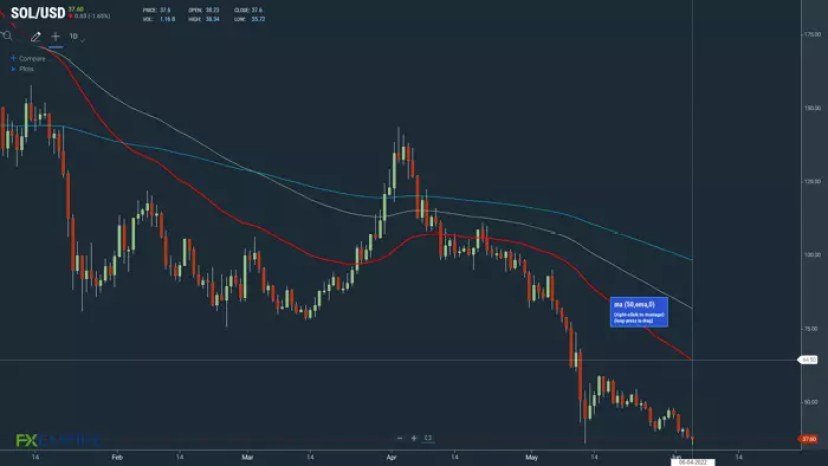
A move from the 100-day EMA, currently at $47, and a bullish break of the 50-day EMA over the 100-day EMA would indicate a shift in sentiment. The daily candlestick chart for
SOL also confirms the current bearish trend. Solana is currently sitting below the 50-day EMA at $65. The 50-day EMA retracted from the 100-day EMA and the 100-day EMA fell from the 200-day EMA; LEFT is negative.
A move to the 100-day EMA, currently at $82, could signal a short-term bearish trend reversal and a return to $100.