United States stock markets are struggling to recover after weeks of nonstop selling. Meanwhile, Bitcoin (BTC) and accompanying altcoins such as SHIB, ETH, DOGE are also trying to recover. So, will altcoins and Bitcoin be able to break through the resistance levels and rally? Here are analyst Rakesh Upadhyay’s analysis of 10 cryptocurrencies…
Analyst’s SHIB, DOGE, BTC comments
Bitcoin held $28,630 support on May 20 and which indicates that the bulls are buying at lower levels. Buyers pushed the price above the downtrend line, which is the first sign of a recovery. According to Upahdyay, if buyers sustain the price above the downtrend line, the BTC/USDT pair could rise to the 20-day exponential moving average (EMA) ($31,758).
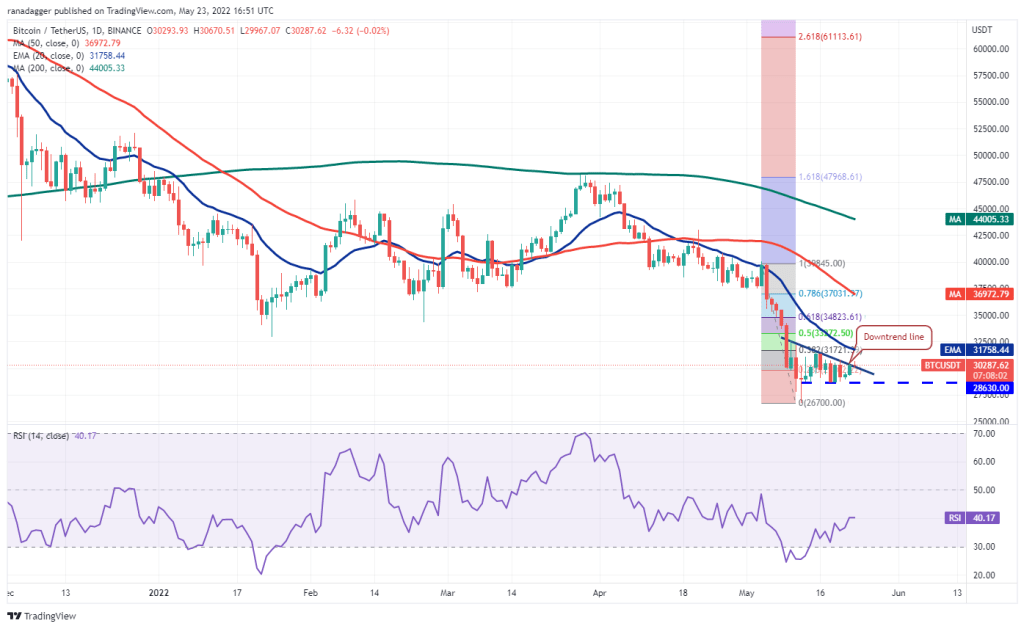
The bears are likely to defend the 20-day EMA aggressively as a break and close above it could open the way for a rally to $34.823. Alternatively, if the price drops from the current level or the 20-day EMA, it indicates that sentiment remains negative and traders are selling in rallies. The bears will need to push the price below $28,630 to clear the way for a possible retest of the critical support at $26,700.
The largest altcoin: what to see in Ethereum?
Ethreum (ETH) bounced off the uptrend line on May 21, indicating that the bulls are buying dips to this level. Buyers will now try to push the price towards the overhead resistance at $2,159, where the bears could pose a strong challenge. If the price breaks through the overhead resistance, it could drop to the bullish line. According to Upadhyay, this is an important level to watch out for in the short term.
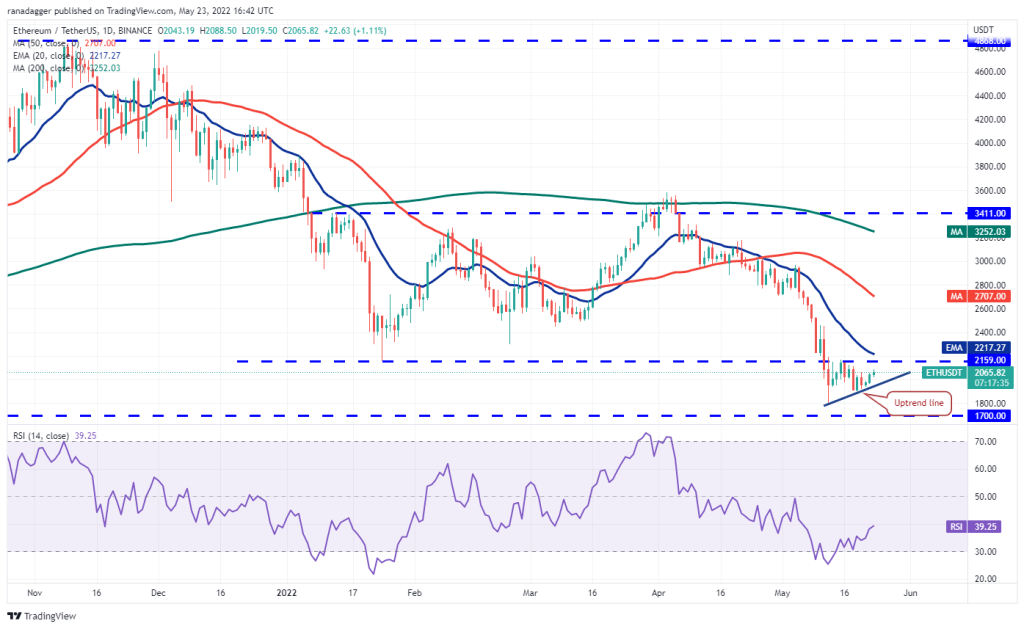
If the price rebounds from the uptrend line, a break above $2,159 might increase the possibility. If this happens, the ETH/USDT pair could attempt to rally to $2,500. On the other hand, if the price breaks from the current level or overhead resistance level and dips below the bullish line, it could indicate that the pair could be stuck between $2,159 and $1,700 for a few days.
Comments on BNB/USDT
The bulls are holding BNB above the 20-day EMA (324), the first sign that the downtrend may be over. dollars) pushed on it. If buyers sustain the price above the 20-day EMA, the BNB/USDT pair could rally to $350 and then to the 50-day simple moving average (SMA) ($374). According to the analyst, the bears may try to stop the upward movement in this region again.
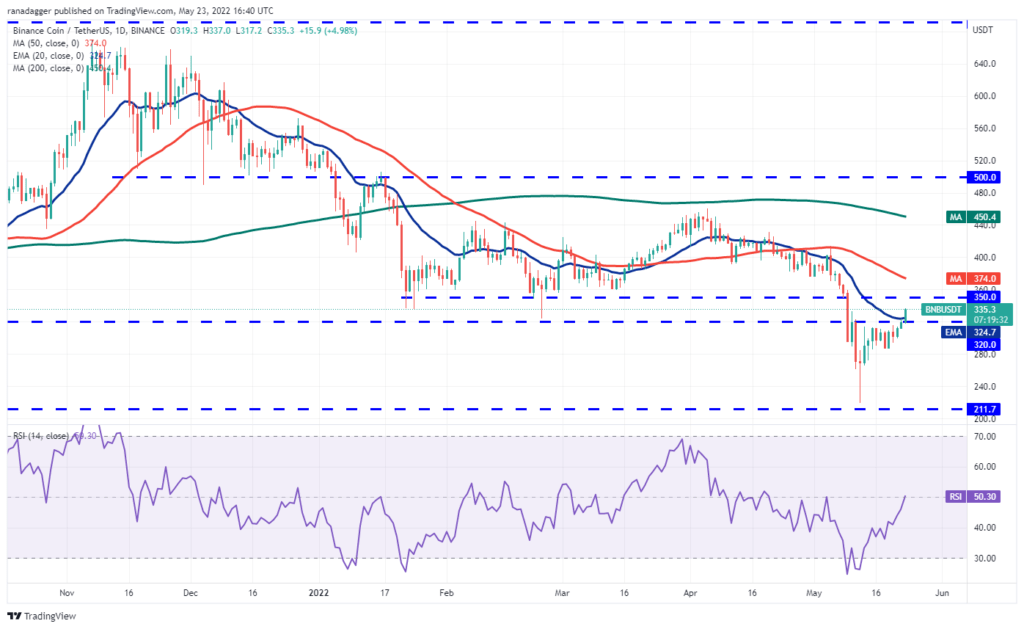
If the price drops from this zone but bounces back from the 20-day EMA, a break above the 50-day SMA will increase the probability. This bullish view will be invalidated in the short term if the price drops and dips below $320. This indicates that the bears are selling at higher levels. The pair could gradually decline to $286 later on.
Ripple (XRP) on the way to recovery
Ripple (XRP) is trying to recover after the bulls successfully defended the immediate support at $0.38 on May 19. Buyers will now try to push the price towards the 20-day EMA ($0.47). The downward sloping moving averages and the RSI in the negative zone suggest that the bears have the upper hand. Sellers will try to vigorously defend the 20-day EMA. If this happens, the XRP/USDT pair could decline from the overhead resistance and decline to the strong support at $0.38.
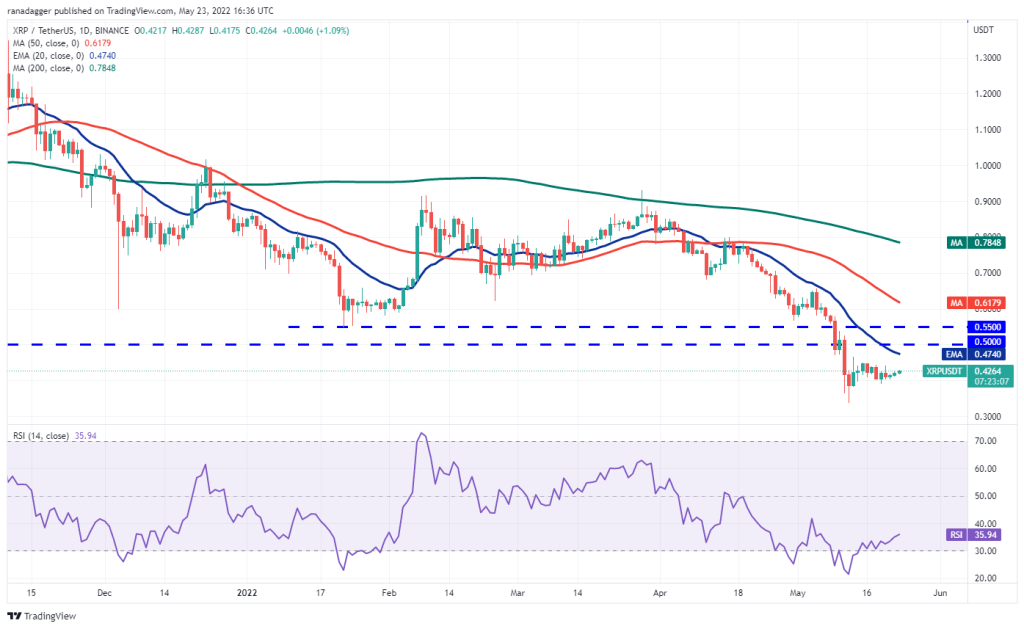
Conversely, if the bulls push the price above the 20-day EMA, it could suggest a possible change in the short-term trend. The pair could then rally to the $0.50 to $0.55 region, which could act as a major hurdle. On the downside, the bears will have to hold and sustain the price below $0.38 to open the doors for a possible retest of the May 12 intraday low of $0.33.
ADA/USDT: Here are the levels to see
The bulls have successfully defended the psychological level at $0.50 over the past few days, showing that demand is at lower levels. Buyers will now try to push Cardano (ADA) above the 20-day EMA ($0.60). If successful, the ADA/USDT pair could attempt a rally to the $0.74 breakout level. Bears are likely to pose a tough challenge at this level.
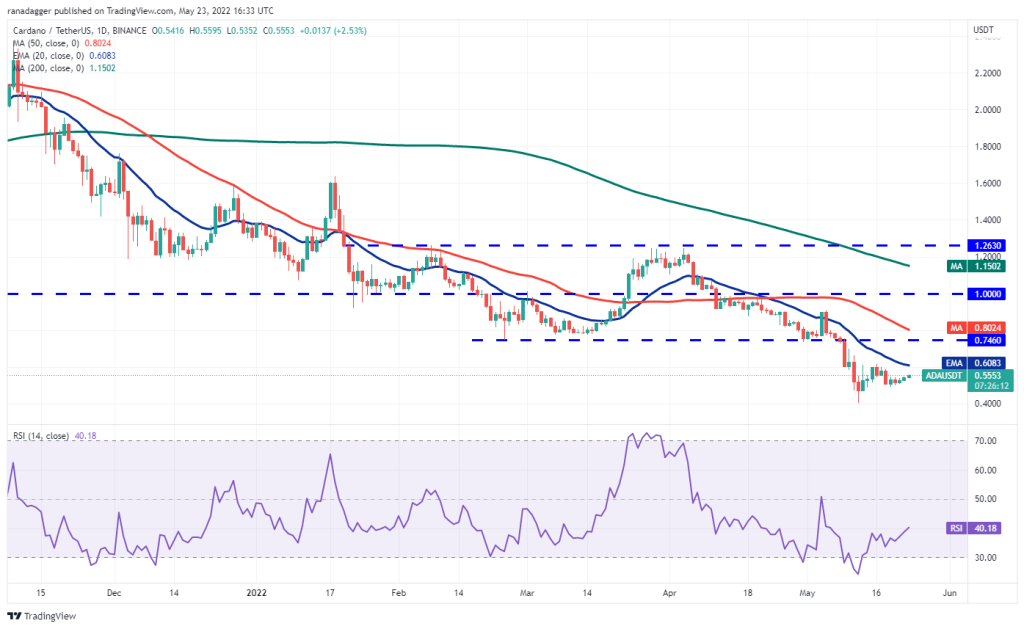
If the bulls stop the next drop at the 20-day EMA, it will suggest a change in sentiment from selling on rallies to buying on dips. Contrary to this assumption, if the price drops from the 20-day EMA, it will indicate that the bears continue to sell in the rallies. The bears will then try to push the price below $0.50 and retest the critical support at $0.40.
SOL/USDT: Drop to $37
Bulls bought SOL from low on May 20 for $47 and Solana (SOL) 20 trying to push towards the daily EMA ($61). Bears are expected to defend this level aggressively. If the price breaks from the 20-day EMA, the SOL/USDT pair could drop to $47, where the bulls will try to stop the decline. If this happens, the pair could trade between $47 and $60 for a few days. A break and close above the 20-day EMA
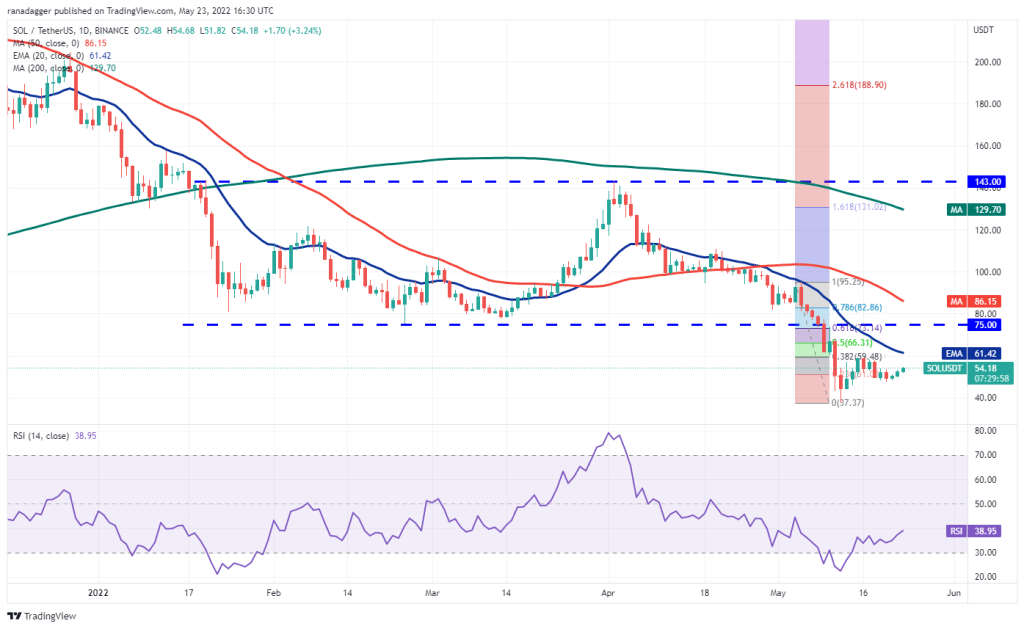
will be the first indication that the bulls are back in the game. The pair could then rally to the breakdown level at $75. Alternatively, if the price drops below $47, the pair could slide towards the strong support at $37.
What’s next for DOGE, the meme coin that inspired SHIB?
According to Upadhyay, Dogecoin (DOGE) is consolidating in a downtrend. The bulls have defended the $0.08 support over the past few days and are trying to push the price towards the overhead resistance at $0.10. If the price drops below $0.10, it will indicate that the bears are attempting to turn this level into resistance. If successful, the DOGE/USDT pair could continue its range-bound move for a few more days.
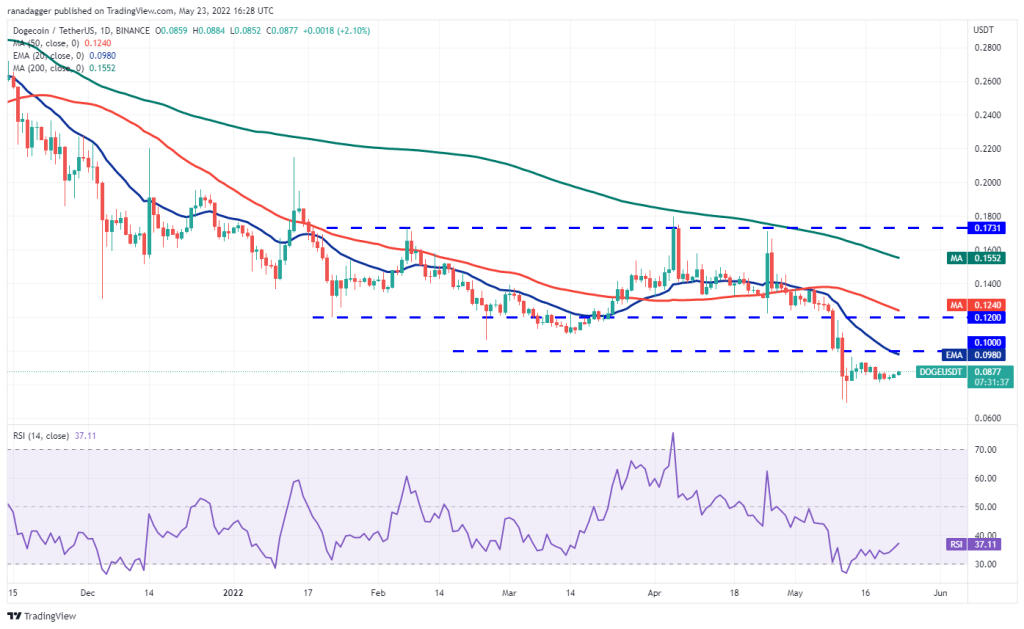
Buyers will have to push the price above $0.10 to show that the downtrend has weakened. The pair could rally to $0.12 later. Alternatively, the pair could retest the critical support at $0.06 if the price declines from the current level and dips below $0.08.
What are the key resistance and support levels for DOT?
Bulls attempt to push and sustain Polkadot (DOT) above overhead resistance at $10.37. If they are successful, the price could rise to the 20-day EMA ($11.57). Buyers will have to push the price above the 20-day EMA to indicate a possible change in the short-term trend. The DOT/USDT pair could then rise to the overhead resistance zone of $14 to $16, where the bears can form a strong defense.
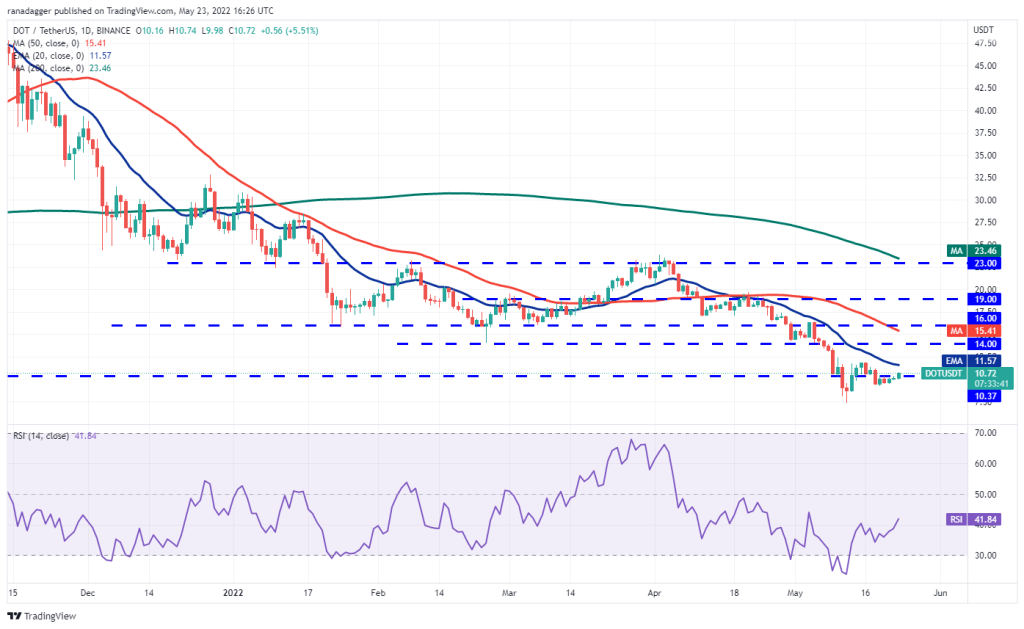
Contrary to this assumption, if the price drops from the 20-day EMA, it will indicate that the trend remains negative and traders are selling on rallies. The bears will then try to push the pair below $9.22 and retest the important support at $7.30.
Bulls defend AVAX
Avalanche (AVAX) rebounded from the support line of the pennant, showing that the bulls are aggressively defending this level. Buyers will now try to push the price above the pennant. If they do, the AVAX/USDT pair could rise to the 20-day EMA ($39). This is an important level to watch out for because bears are expected to fiercely defend it.
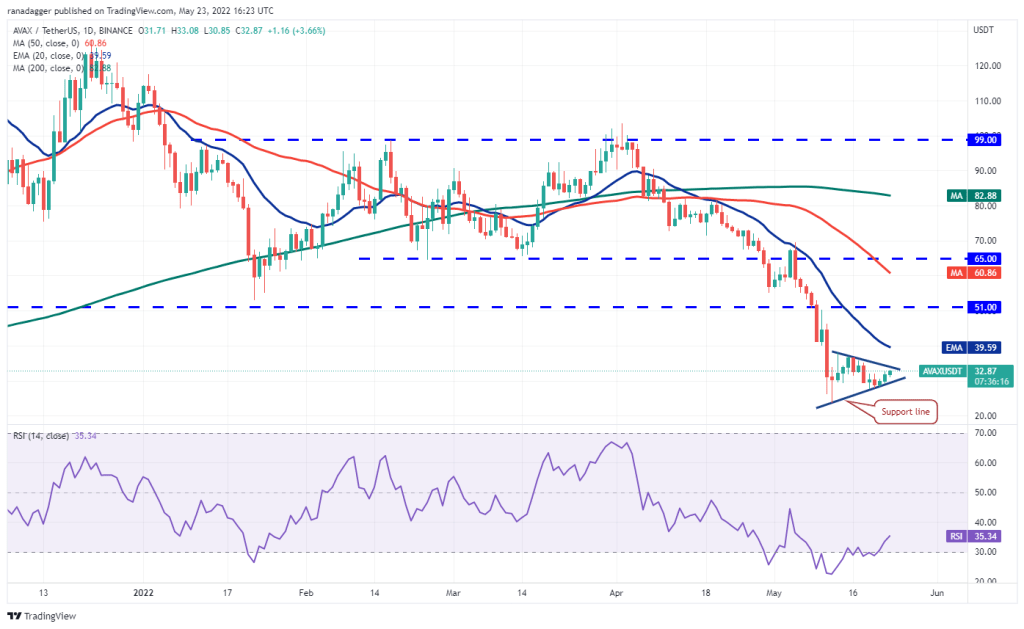
If price drops from the 20-day EMA but does not re-enter the pennant, it will suggest a possible change in trend. Buyers will then attempt to break through the general hurdle at the 20-day EMA and push the pair towards $51. Conversely, if the price breaks from the current level or the 20-day EMA and breaks below the support line, it will indicate that the bears are active at higher levels. The pair could slide to $23 later.
Analyst: Next stop for SHIB could be $0.00005
Shiba Inu (SHIB) is trying to break above the immediate resistance at $0.000013 but the longer candlestick of the day The wick indicates that the bears are trying to stop the rally. If the price breaks down from the current level, the SHIB/USDT pair could spend some more time between $0.0000010 and $0.000014. The next trend move could start after the price breaks above or below the range.
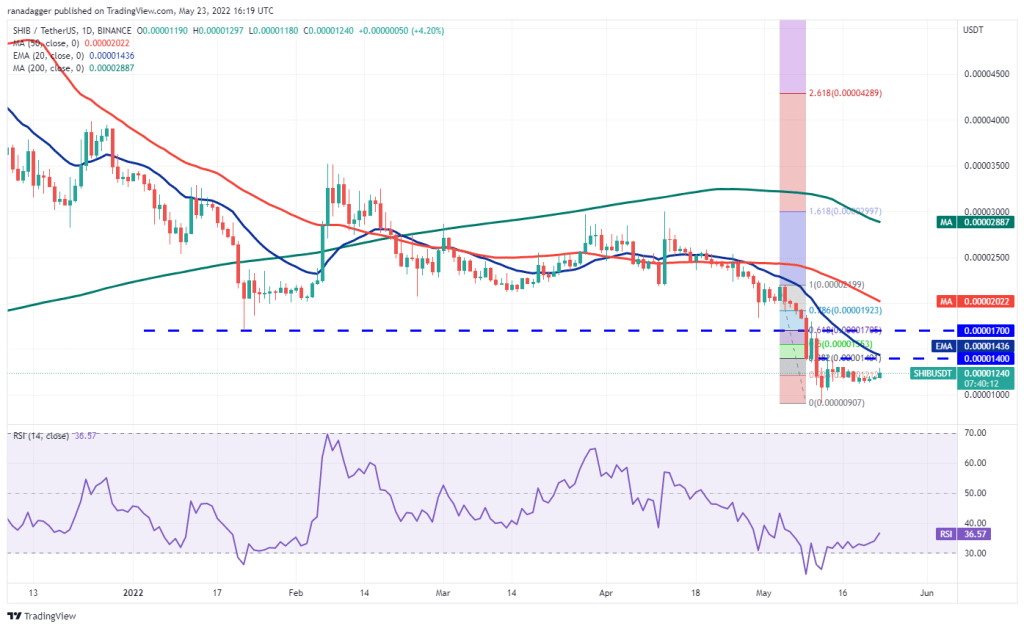
Buyers could attempt a rally up to $0.000017 if the price rises above the 20-day EMA ($0.00014). This level can act as a stiff resistance again. Alternatively, the pair could drop to $0.000009 if the price declines and dips below $0.0000010. This is an important level to consider, as the next stop could be $0.000005 if it is broken.


