Bitcoin bulls are fighting to maintain the $20,000 level. A few altcoins such as SHIB and DOGE have rallied up to 10 percent. Whales are already starting to accumulate lower, although several analysts have announced bearish forecasts for Bitcoin in the near-term. Data from on-chain research firm Santiment shows that the number of whale addresses holding between 100 and 10,000 Bitcoins has increased by 103 in the last 30 days.
How will a possible Bitcoin recovery affect many altcoins such as SHIB and DOGE?
In bear markets, rumors usually spread fast. This causes rapid declines. As we have also reported as Kriptokoin.com, Mt. Gox creditors said the rumor that he was going to issue 137,000 Bitcoins circulating on social media was false. Creditors said the infrastructure needed to initiate repayment is still not in place. However, a possible Bitcoin recovery will also see rallies in major altcoin projects. Will Bitcoin and major altcoins continue to recover? Analyst Rakesh Upadhyay seeks the answer to this question. We convey the opinions of the analyst.

Here are the Critical Levels for BTC, SHIB, DOGE and 7 Altcoins:
Bitcoin (BTC) Ethereum (ETH)
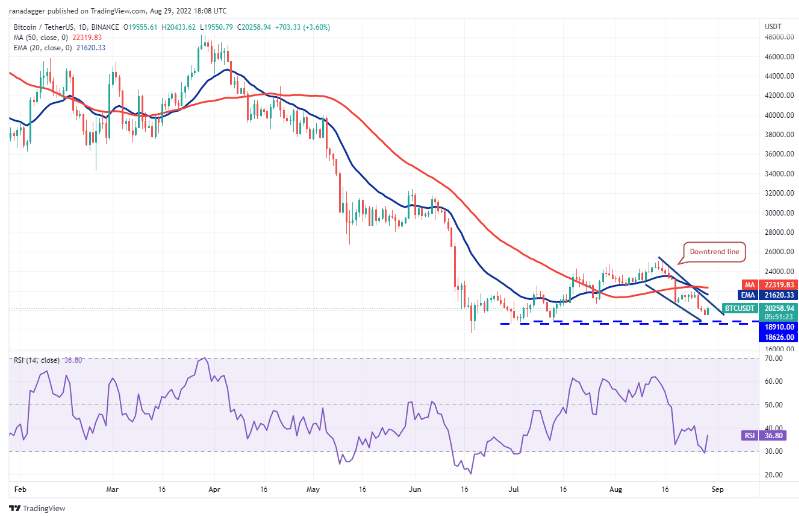
Bitcoin closed below the psychological level of $20,000 on August 28. Buyers pushed the price above $20,000 on August 29. This indicates strong demand at low levels. BTC could rise to the critical 20-day exponential moving average (EMA) ($21,620). If the bulls push the price above this resistance, it signals that the bearish momentum is weakening. A break above the moving averages will open the doors for a possible rally to $25,211. Alternatively, the price could decline from the downtrend line or moving averages. This will indicate that the bears are being sold on every small rise. The pair then dips into the strong support zone from the $18,910 high to $18,626 low. Your bulls will defend this area with all their might. Because if the support breaks, there are chances of a drop to the June low of $17,622.
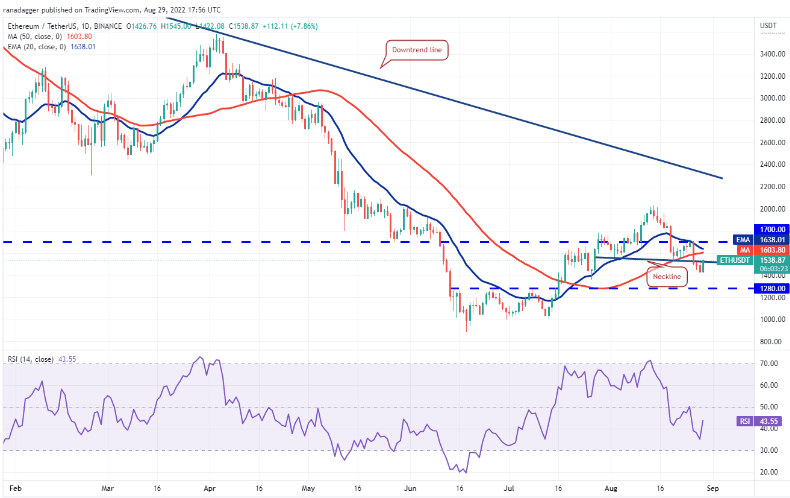
Ethereum bounced back from the 20-day EMA ($1,638) on August 26. So the shoulder fell below the neckline of the head shoulder pattern. This completes the fall setup. However, the bears failed to sustain the price below the neckline. This shows that there is buying on the declines. The bulls are trying to challenge the overhead resistance at $1,700. If they are successful, there is a possibility that ETH could rise to the psychological level of $2,000. Conversely, the price may decline from the current level or moving averages. This will indicate that the bears are active at higher levels. If the price declines, the pair could decline to the strong support at $1,280. The bulls are expected to defend this level aggressively. However, if they fail to do so, the pair will drop to $1,050.
BNB and Ripple (XRP)
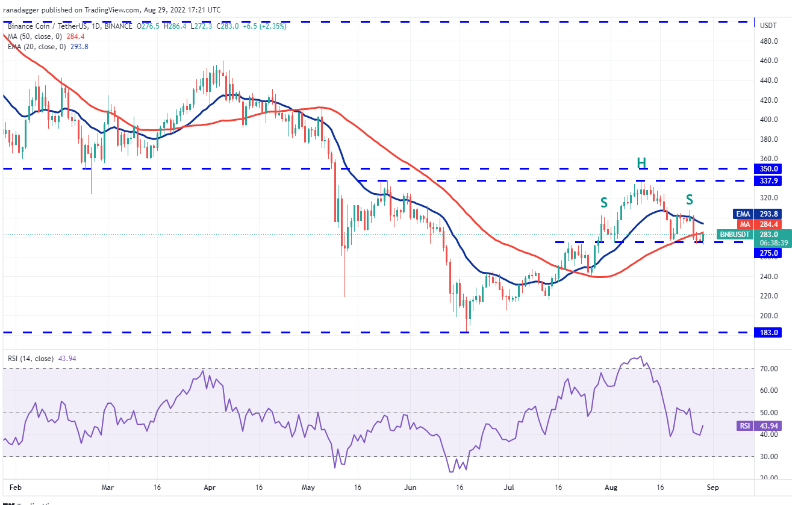
The failure of the bulls to sustain the price above the 20-day EMA ($293) on August 25 resulted in heavy selling. BNB bounced back sharply on August 26. Thus, it fell below the 50-day simple moving average (SMA) ($284). The upside is that the bulls are not allowing the price to stay below the strong support at $275. Buyers are trying to push the price above the 50-day SMA. If they are successful, BNB will rise to the 20-day EMA. The bulls need to push the pair above $308 to open the doors of a possible rally to $338. Conversely, if the price drops below $275, it will complete the head-to-shoulder pattern. This downside setup will start a decline to the $240 and then $212 target.
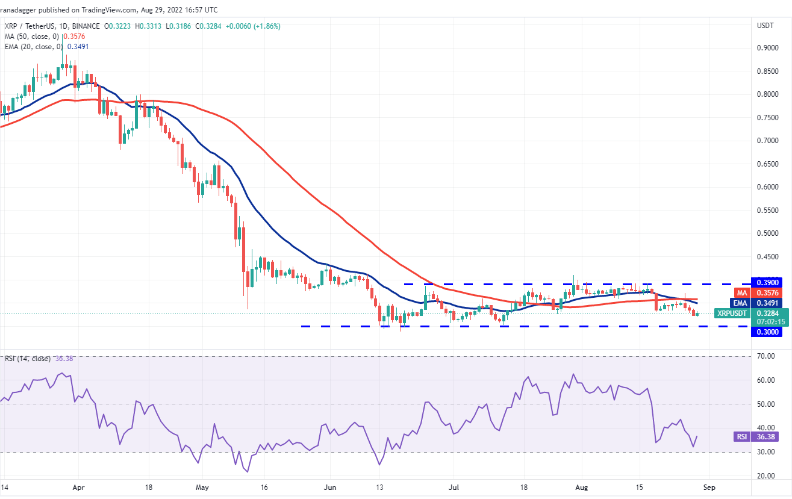
The bulls failed to keep Ripple (XRP) above the August 26 moving averages. This suggests that the breakout could be a bull trap. These intensifying sell-offs and bears are trying to push the price towards the strong $0.30 support. Buyers are likely to aggressively defend the $0.30 support. Because if the support is broken, XRP will start the next leg of the downtrend. It will then fall to $0.25 and then to its target of $0.21. Alternatively, there are chances for the price to recover strongly from $0.30. Thus, it will show that there is strong demand at lower levels. The bulls will then try to push the price back above the moving averages. If they can do this, they will rally for the strong overhead resistance at $0.39.
Cardano (ADA) and Solana (LEFT)
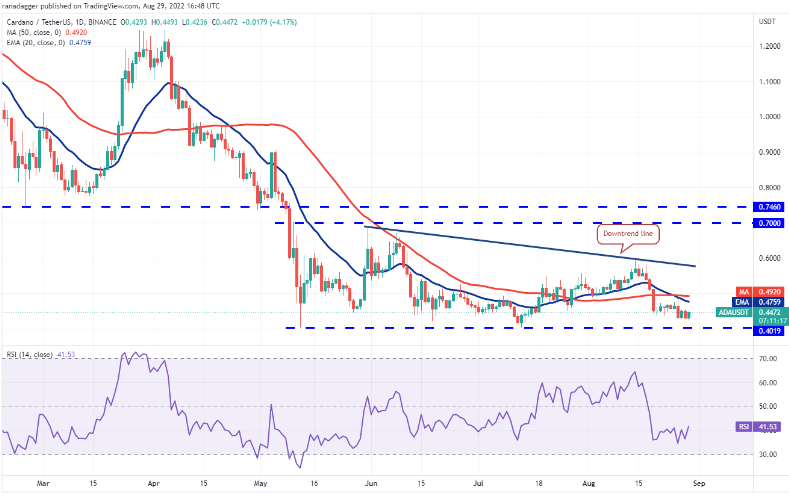
Cardano (ADA) continues to slide towards the strong support at $0.40. The bulls are trying to push the price above the moving averages. If they succeed, the ADA will rise to the downtrend line. Thus, it could attempt an upside move to the $0.70-$0.74 resistance area later. On the other hand, there is a possibility that the price will drop from the moving averages once again. Thus, it will indicate a lack of demand at higher levels. The bears will then try to push the price below $0.40 and continue the downtrend.
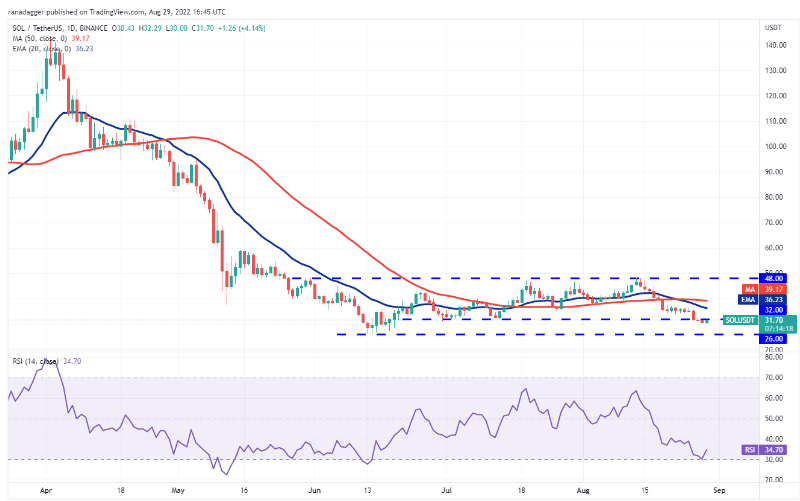
Solana (SOL) holds below the strong support at $32 on August 26. The bulls are trying to push the price back above the $32 breakout level. If they succeed, the SOL will fall to the 20-day EMA ($36). This is an important level to consider. Because a break above this could increase the likelihood that the pair will stay in the $32 to $48 range for a few more days. Conversely, the price could decline from the current level or the 20-day EMA. This will show that the bears are under control. The pair is likely to drop to the critical support at $26 later. A break below this level marks the start of the next leg of the downtrend.
Dogecoin (DOGE) and Polkadot (DOT)
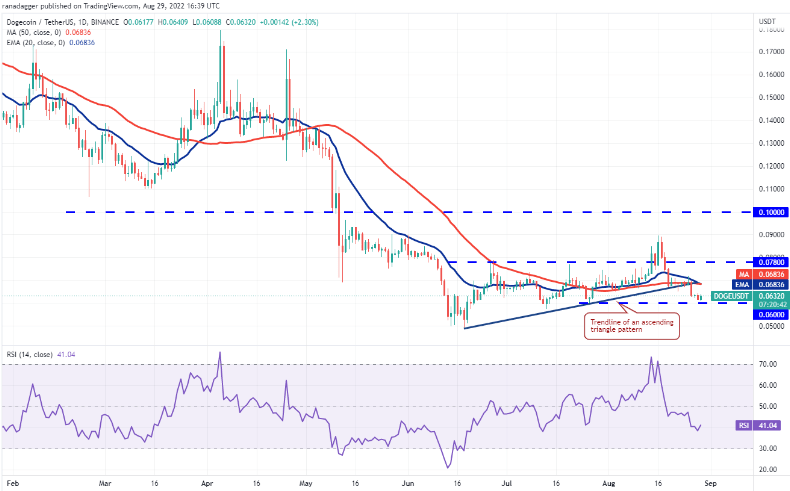
Dogecoin stayed below the trendline of the ascending triangle on August 26. This invalidated the ascension setup. The price dropped to the critical support at $0.06. If the price bounces back from the current level, it will suggest that the bulls can pile up on the dips. Buyers will then try to push the price back above the moving averages. If they succeed, DOGE rises to $0.08. However, there are chances of the price dropping below $0.06. Thus, selling may intensify and the pair may decline to the critical support at $0.05. The bulls are likely to defend this support with all their might. Because if the level cracks, the pair resumes its downtrend.
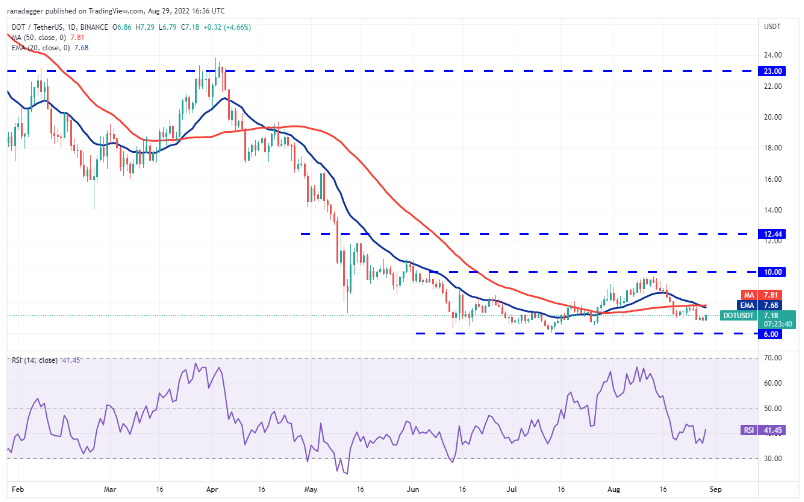
Polkadot is stuck in the wide range of $10 to $6. The bearish 20-day EMA ($7.68) and the RSI in the negative zone point to an advantage for the bears. The bulls are trying to push the price above the moving averages. If they do, the DOT will rally higher towards $9.17 and then the overhead resistance at $10. Conversely, if the price drops from the moving averages once again, it will indicate that the bears are selling in the rallies. The pair then drops to the critical support at $6.
Shiba Inu (SHIB) and Polygon (MATIC)
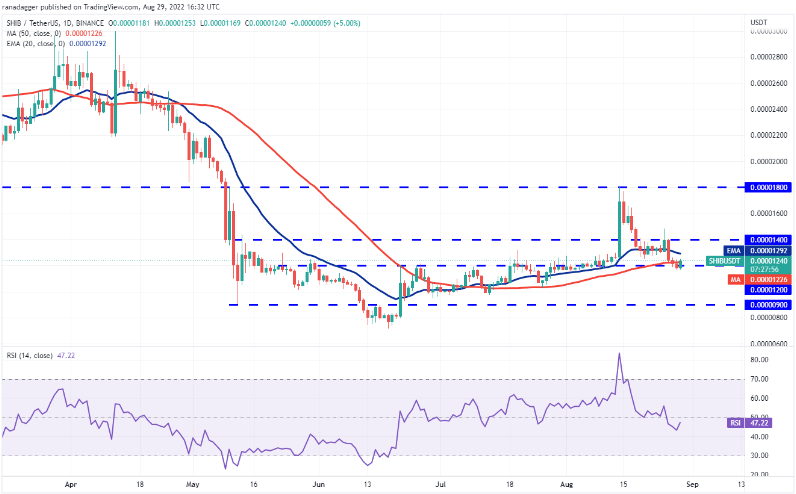
SHIB closed below the critical support of $0.000012 on August 28. But the bears could not develop the advantage. This indicates that the bulls are buying at the bottoms. If buyers hold the price above the 50-day SMA ($0.000012), the SHIB could attempt a rally to the overhead resistance at $0.000014. If the price breaks down from this level, SHIBI could be stuck between $0.000012 and $0.000014 for a while. If the bulls propel the price above $0.000014 and sustain it, there are chances that the pair could rise to the stiff resistance of $0.000018. This bullish outlook will be invalidated in the near term if the price drops and dips below the August 28 intraday low.
MATIC’s recovery faced stiff resistance at the 20-day EMA ($0.83) on Aug. 28, showing the bears defending the level aggressively. MATIC bounced off the strong support at $0.75 on August 29, showing that the bulls had bought the dips to the support of the range. The pair is stuck between the 20-day EMA and $0.75, but this tight futures trade is unlikely to continue for long. If buyers push the price above the moving averages, the pair could rally to the overhead resistance at $1.05, where the bears could pose a strong challenge again. Alternatively, if the price dips below $0.75, there are chances for the pair to drop to the strong support at $0.63.


