
While the bears are trying to extend Bitcoin (BTC)’s nine-week red candle record to ten weeks in a row, the bulls are trying to avoid this downside attempt. Altcoin projects, on the other hand, are waiting for a recovery from Bitcoin to relax.
Could possible Bitcoin recovery ease altcoin projects?
While sentiment remains negative, Arthur Hayes, former CEO of BitMEX, expects Bitcoin to bottom in the $25,000 to $27,000 range. On-chain data suggests that smart money may have started accumulating Bitcoin. Net outflows from leading cryptocurrency exchanges reached 23,286 Bitcoins on June 3, the highest level since May 14, as we reported on Kriptokoin.com.

Another sign of positive accumulation was strong investment in Bitcoin exchange-traded products (ETPs) in May, and according to an Arcane Research report, It increases even more in the first two days of June. ETPs hold 205,000 Bitcoins under management, which is a new record. A recovery by the leading cryptocurrency could also relax the entire altcoin market. Can Bitcoin emerge and start a recovery? If this happens, which altcoin projects will lead the relief rallies? This week, we are presenting the charts and analyst views of 5 cryptocurrencies that we should not miss, that can lead to a relief rally.
Here’s Bitcoin and 4 altcoins to watch this week:
Bitcoin (BTC)
Bitcoin hit the 20-day exponential moving average ($30,459) on June 1st ) fell below. The bulls tried to push the price back above the 20-day EMA on June 2 and June 3, but the bears did not give up. The bears will try to push the price below the strong support at $28,630. If they do, the BTC/USDT pair could drop to the vital support at $26,700. Buyers are expected to defend this support zone with all their might because if they fail to do so, the downtrend could continue. On the upside, the bulls will have to push and sustain the price above $32,659 to suggest the start of a new uptrend. The uptrend could be caught by a breakout and close above the 50-day simple moving average ($33,778).
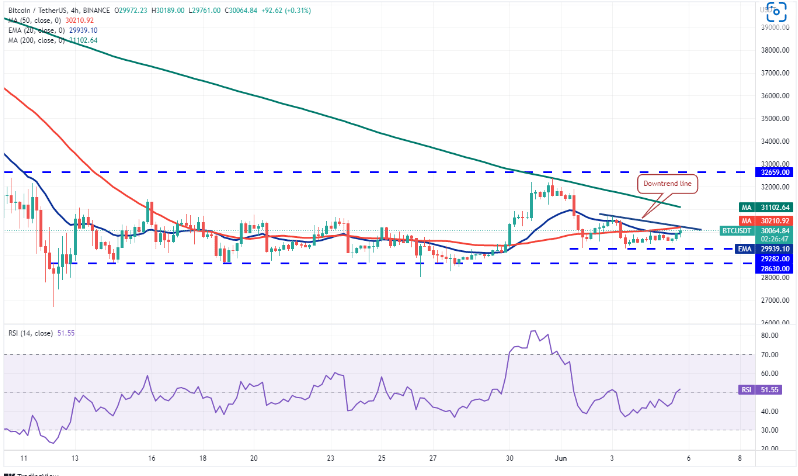
The 4-hour chart shows that price action is stuck. Although the bulls push the price above the 20-EMA, they are facing stiff resistance at the 50-SMA. This suggests that bears are active at higher levels. A minor positive in favor of the bulls is that they did not allow the price to drop below the support at $29,282. If the price rises from the current level and rises above the downtrend line, the bulls will try to push the pair to the 200-SMA. Conversely, if the price dips below $29,282, the next stop could be $28,630.
Cardano (ADA)
Cardano (ADA) broke above the downtrend line on May 31, but the bulls were out of the long wick on the day’s candlestick. As can be seen, it could not sustain higher levels. While the bears have successfully defended the downtrend line, a minor positive is that the bulls are holding the ADA/USDT pair above the 20-day EMA ($0.56). This increases the likelihood of a break above the downtrend line. If this happens, the pair could rally to the 50-day SMA ($0.67), where the bears could pose a strong challenge again. A break and close above this level will indicate a potential change in trend. Contrary to this assumption, if the price drops and dips below $0.53, the bears will try to push the pair down to $0.50 and later to $0.44. The 4-hour chart
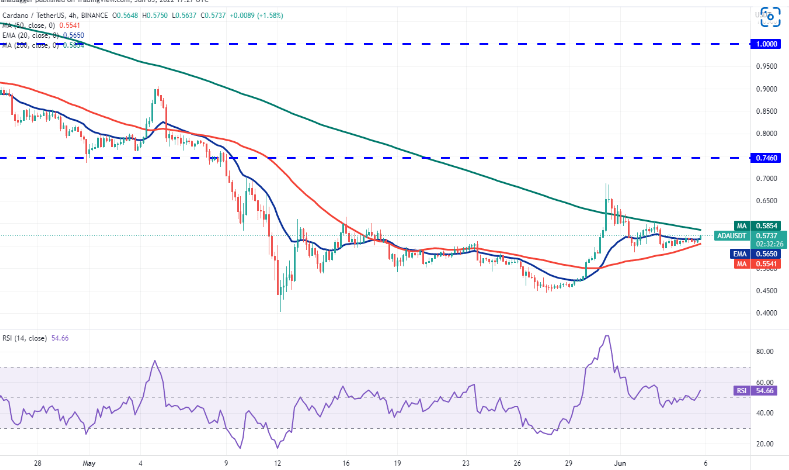
shows price stuck between the 200-SMA and the 50-SMA, but this tight-range trade is unlikely to continue for long. If the bulls propel the price above the 200-SMA, the pair could attempt a rally to $0.64. A break and close above this level could open the doors for a possible rally to $0.69. Conversely, if the price drops and dips below $0.53, selling could gain momentum. The pair could decline further to $0.50 and then to $0.47.
Stellar (XLM)
Stellar (XLM) rose above the 20-day EMA ($0.14) on May 30, suggesting that selling pressure may ease. It was the first indication. If the bulls push the price above the 50-day SMA, it will suggest the start of a sustainable recovery. The XLM/USDT pair could then attempt a rally to $0.18 and then to the 200-day SMA ($0.21). This positive view will be invalidated in the short term if the price declines and dips below $0.13. Such a move would indicate demand drying up at higher levels. This could drop the pair as low as $0.12. If this support gives way, the bears will try to continue the downtrend by pushing the pair below the psychological $0.10 level.
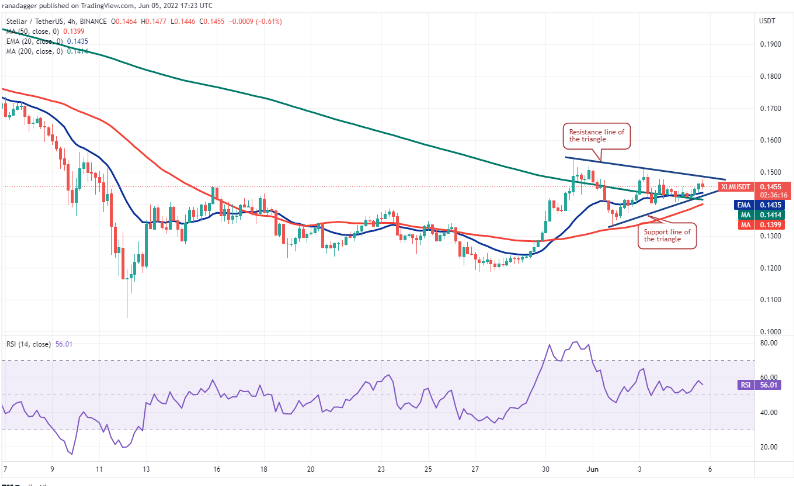
The 4-hour chart shows that price is trading within a symmetrical triangle. If the bulls propel the price above the resistance line of the triangle, the pair could rally to $0.15 and then attempt a rally to the $0.17 pattern target. Alternatively, if the price drops from the current level, the bears will attempt to sink the pair below the support line of the triangle. If they do, the sell-off could intensify and the pair could slide towards the strong support at $0.13.
Monero (XMR)
Monero (XMR) failure to break above the 50-day SMA ($202) may have encouraged short-term investors to take profits. This brought the price down to the 20-day EMA ($189). The bulls are trying to defend the 20-day EMA but the lack of a strong bounce indicates weak demand. If the price stays below the 20-day EMA, the next stop could be the uptrend line. A break and close below this support could bring the price down to $167. On the contrary, if the price bounces back from the current level, buyers will try to overcome the resistance zone between the 50-day SMA and $210. If they manage to do so, the XMR/USDT pair could rally to $230.
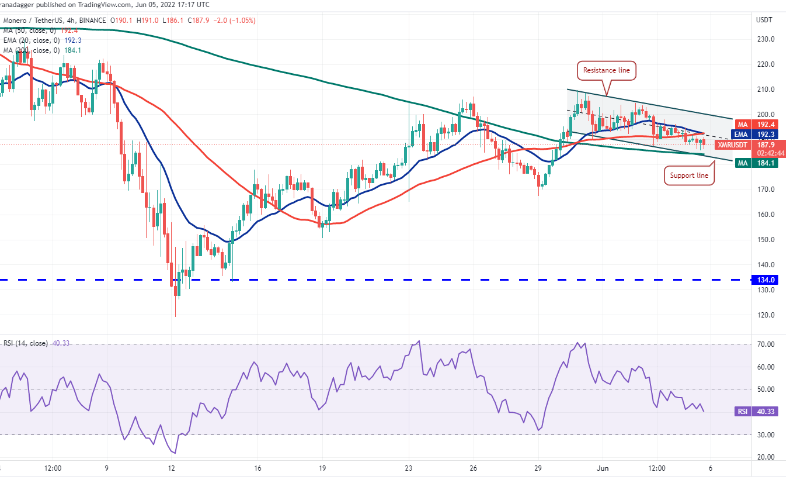
The pair is falling inside a descending channel, giving sellers a small advantage. If the bears sink the price below the channel, the negative momentum could gather and the pair could drop to $167. Alternatively, if the price bounces back from the support line, buyers will try to push the pair above the channel. If they do, the pair could attempt a break above the overhead resistance at $210 again.
Decentraland (MANA)
Decentraland (MANA) hasn’t been able to break above the 20-day EMA ($1.06) for the past few days, but one small positive is that the bulls haven’t given up much ground. to be. This suggests that the bulls are buying on the dips as they expect a higher move. If the bulls push the price above the 20-day EMA, it will indicate that the bears have lost their grip. The MANA/USDT pair could then rise to the overhead resistance at $1.36. This is an important level to watch out for, as a breakout and closing above it could indicate that a bottom may be in place. The pair could rally to $1.68 later. The pair could then retest the critical support at $0.60. The 4-hour chart
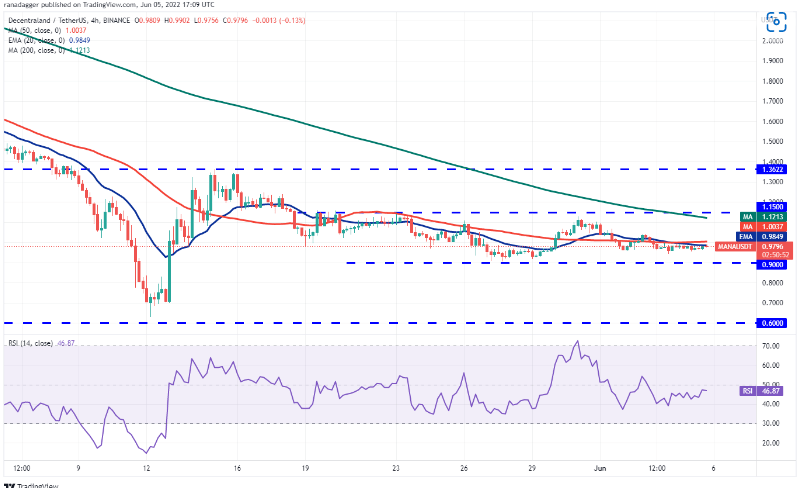
shows that the pair is trading in a narrow range between $0.94 and $1.04. The increasingly downward sloping 20-EMA and RSI indicator in the negative region gives sellers a slight advantage. If the bears pull the price below $0.94, the pair could drop to $0.90. Conversely, if the bulls push the price above $1.04, it will indicate that demand has outstripped supply. This could open the doors for a possible rally to the stiff overhead resistance at $1.15. If the price drops from this level, the altcoin could oscillate between $0.90 and $1.15 for a while. A break and close above $1.15 might indicate that buyers have the upper hand.