
Experts point to historical patterns for the price of the leading cryptocurrency Bitcoin (BTC). However, historical models point to the ATH level for Bitcoin on this date! Here are the details…
What does the historical model of Bitcoin show about the BTC price?
cryptocoin.com As we reported, the leading cryptocurrency Bitcoin (BTC) has been struggling to surpass the important $30,000 price level in recent weeks, despite renewed support from factors such as the United States banking crisis. While the leading crypto by market cap has been a lackluster performance, market analysts are keeping a close eye on the next price trajectory, especially regarding the next all-time high.

Notably, prominent crypto analyst @El_crypto_prof, who posted on Twitter on May 13, suggested that Bitcoin’s price action often follows a pattern of higher highs and higher lows that lead to a parabolic rally. This means that the cryptocurrency tends to rise even faster as its value increases, resulting in exponential growth. Based on this model, the analyst suggested that Bitcoin could reach an all-time high before 2025. This is because, according to the expert, the cryptocurrency has consistently exhibited a series of higher lows over the past few months. This may indicate that it is on its way to forming a new high peak.
#Bitcoin (W)
Looking at my timeline, there are only a handful of analysts who see what $BTC is doing here.
It works on the upside just like it works on the downside.
A series of higher highs and higher lows eventually results in a parabolic rally.
New ATH before 2025 imo. pic.twitter.com/DrtgtEqwaT
— 𝕄𝕠𝕦𝕤𝕥𝕒𝕔ⓗ𝕖 🧲 (@el_crypto_prof) May 13, 2023
What are the factors that will affect the Bitcoin price in the future?
Apart from historical patterns, experts also rely on factors such as the upcoming halving for Bitcoin and possible regulatory clarity as a potential basis for a new all-time high. The last record was broken in late 2021, when the coin reached almost $69,000. On the other hand, it should be noted that Bitcoin has not been able to maintain its gains above the $30,000 level since mid-April. Due to the volatility caused by low liquidity in the crypto money markets, as of May 12, the crypto currency saw its lowest trading level since mid-March, falling below $ 27,000.

The renewed losses in Bitcoin can also be attributed to increased regulatory scrutiny in the industry. Recently, Bitcoin miner Marathon Digital received a subpoena from the US Securities and Exchange Commission (SEC), raising concerns about possible violations of the Federal Securities Laws through related party transactions. This development created uncertainty for the publicly traded mining company. As Bitcoin tries to set a new record, the crypto community is predicting a possible price drop in the coming weeks. According to reports, a crypto community with 82 percent historical accuracy predicts that Bitcoin will likely drop to $24,753 on May 31 and trade at that level.
Technical indicators for BTC price
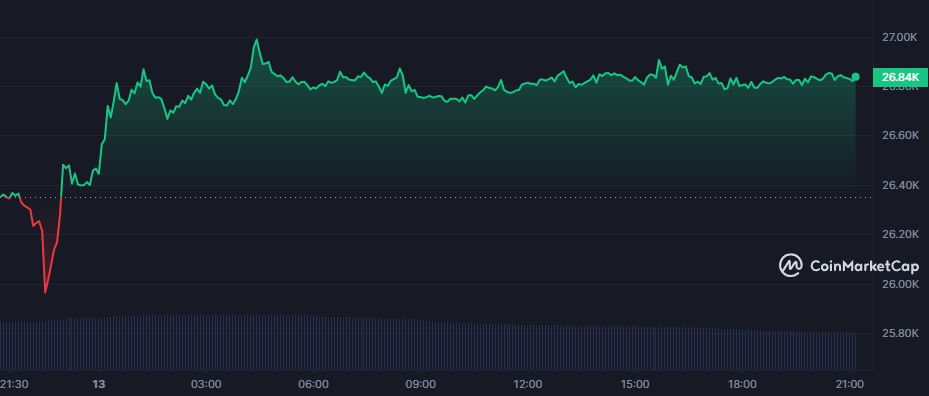
Instantly, Bitcoin is trading at $ 26,801. This indicates an increase of 1.6%.
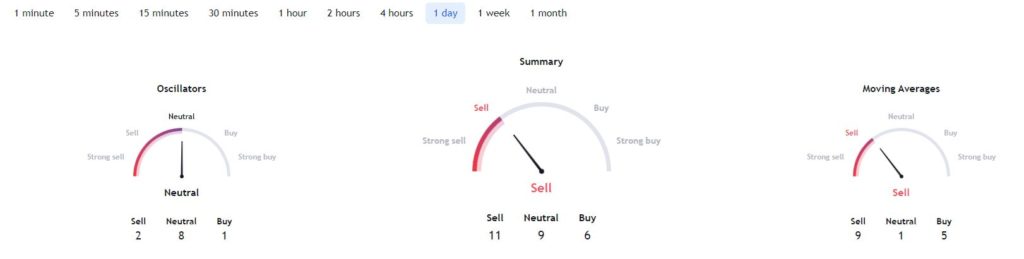
Looking at the technical analysis of BTC, it seems that the downward trend is dominant. According to a review of one-day indicators from TradingView, suggested sentiment is “sell” at 11, Moving averages point to “sell” sentiment at 9, while oscillators are neutral at 8.
On the other hand, Bitcoin is trying to break above the $27,000 support level, potentially creating space for it to reclaim the $30,000 level.