Legendary cryptocurrency analyst PlanB says that the Bitcoin price has now confirmed the bottom. The analyst, known for his Stock-to-Flow (S2F) model, has updated its 6-digit price targets.
PlanB dates Bitcoin price within $100,000
The inventor of the S2F model recently doubled down on his prediction that Bitcoin (BTC) could see a meteoric rise in the upcoming bull market. The analyst recently said on Twitter that Bitcoin dropped to $15,500 in November 2022 and that short-term investors now believe it is in the profit zone, often referred to as a bullish signal. PlanB also noted that it has seen Bitcoin rise above $30,000 around 2024 before a parabolic surge in 2025.
My 2nd target for Bitcoin price: Nov 2022 low of $15,500 – BTC has passed Short Term Holder (STH) and will rise to halving in 2024 and then bull market in 2025. Several on-chain signals confirm the STH signal.
2024 halving > $32,000 – 2025 bull market > $100,000.
My 2 sats on #bitcoin price:
– November 2022 low of $15,5K was the bottom
– BTC has crossed Short Term Holder (STH) and will rise into 2024-halving and subsequent 2025 bull market. Several on-chain signals confirm STH signal.
– 2024 halving will be >$32K
– 2025 bull market >$100K pic.twitter.com/0QtbeOXwsG— PlanB (@100trillionUSD) January 12, 2023
According to CoinMarketCap, at the time of PlanB’s analysis, BTC is trading at $20,500 with a relatively 8% price increase in the last 24 hours. The crypto analyst expects Bitcoin to trade above $32,000 in 2024 and over $100,000 in 2025.
“Bitcoin may rise 5,000%”
PlanB also added that the upcoming bull market will have a wide range and Bitcoin could see a jump to $1 million, an increase of about 4,689% over current prices:
I actually think the bull market range would be $100,000 – $1 million, but many people don’t understand wide margins so I fixed it at $100,000 which is really comfortable.
1M is a bull market, 100K is a comfort blanket.
— Sieme (@dorstvlegel) January 12, 2023
BTC sees an increase of over 10%, watch out for these
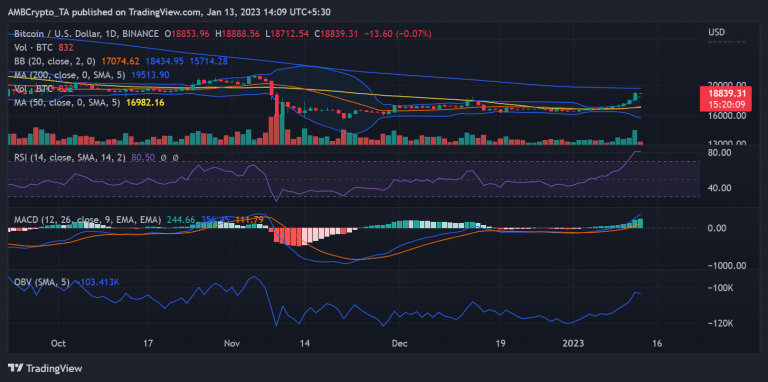
Bitcoin’s price rallied to $18,800 and then to the 20,500 range after a recovery that began while trading around $15,000. Analyzing BTC’s price action on a daily time frame, it turned out that the coin gained almost 11%.
Further data analysis revealed that BTC broke the initial resistance provided by the short Moving Average (yellow line). If a rally continues, your long Moving Average (blue line) shows that there is enough strength for higher highs.

Additionally, whales, another bullish catalyst, are supporting the price increase in the last rally. A chart from Santiment showed whale trading activity increased for the first time in two months. Roughly more than 1,700 Bitcoin transactions exceeding $1 million were processed daily.
📈 #Bitcoin is on the verge of breaking the $19k resistance level for the first time since Nov. 8th. Whales are beginning to take interest and are likely perpetuating this climb, with $1M+ $BTC transactions rebounding to November, 2022 levels. https://t.co/UuH8aFUmh3 pic.twitter.com/2oeIyi3xSV
— Santiment (@santimentfeed) January 12, 2023
According to historical data, whales last performed this many transactions in November 2022. As long as the trading volume remains this high, BTC will remain viable for higher highs. Again, cryptocoin.comAs we have reported, some analysts warn that there may be a drastic correction in the short term.


