
The crypto analyst with a large following says that Bitcoin is preparing for a big rally next year. The analyst also shares 6 potentially explosive altcoin projects.
Analyst expects a rally from leading altcoin and leading crypto
Popular analyst Michaël van de Poppe says he expects Bitcoin to ignite major rallies towards the $42,313 and $50,324 targets by June 2023, based on key Fibonacci levels. “Aid rally targets for Q2 2023 in Bitcoin,” the analyst shares the chart.
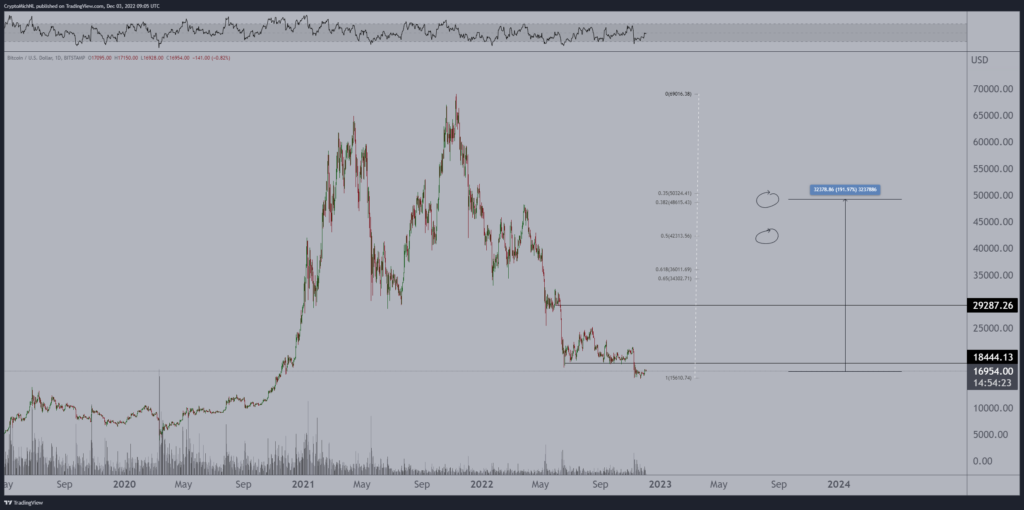 Source: Van de Poppe/Twitter
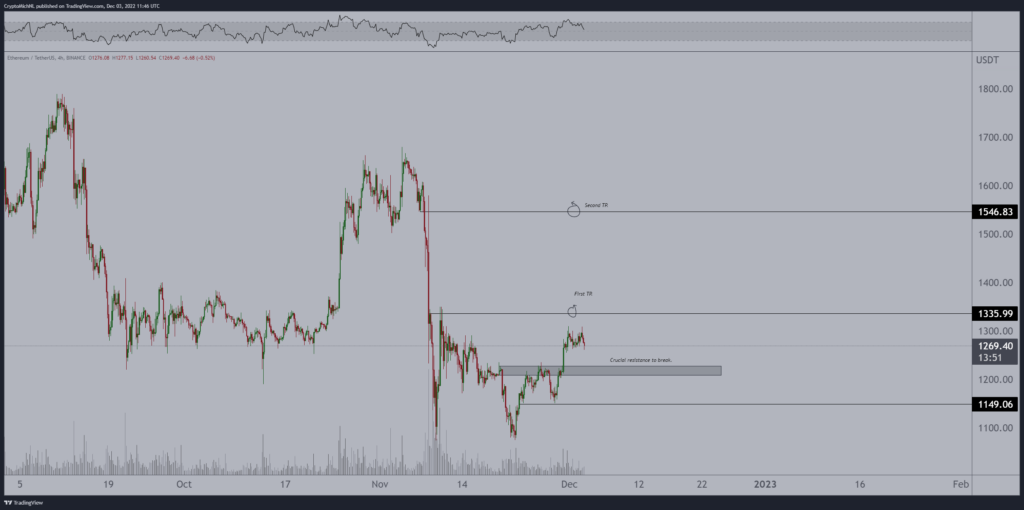
The analyst is closely watching Ethereum (ETH), which he says will likely continue its uptrend once it breaks the $1,200 resistance. In this context, Van de Poppe notes:
Ethereum did not reach the target price. If I was looking for long positions, I would look into this. Because it did not reach the optimum entry zone. I’m still waiting for the outlook to likely continue after this breakout.
 Source: Van de Poppe/Twitter
ATOM and ENS are also on Van de Poppe’s radar
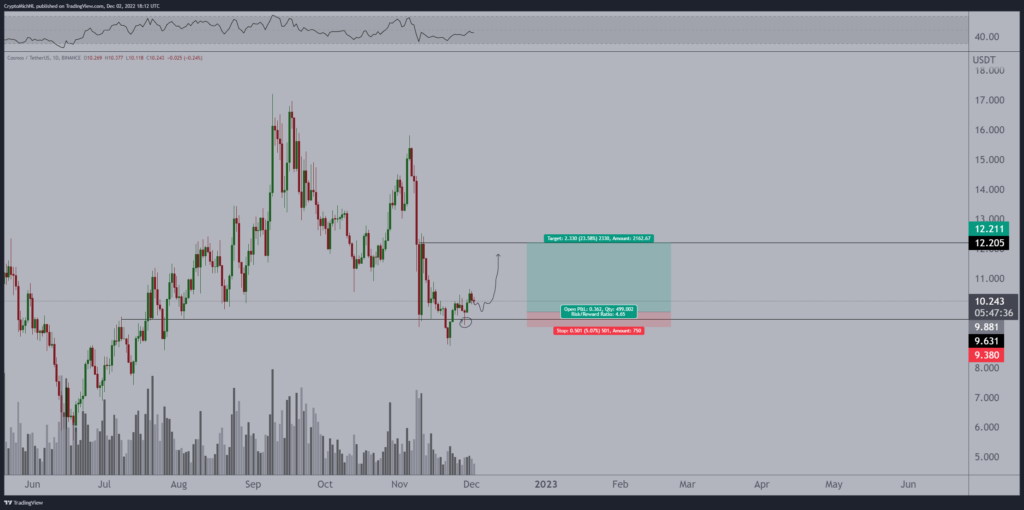
Next up is Cosmos (ATOM), a blockchain ecosystem designed to scale and communicate with each other. According to Van de Poppe, the uptrend is possible as long as Cosmos trades above $10. Accordingly, the analyst makes the following statement:
This seems a bit in the middle. A good resistance to support and retrace $9.40. But there is nothing more powerful. I’d rather keep it around $10 to continue and then look at $12.25.
 Source: Van de Poppe/Twitter
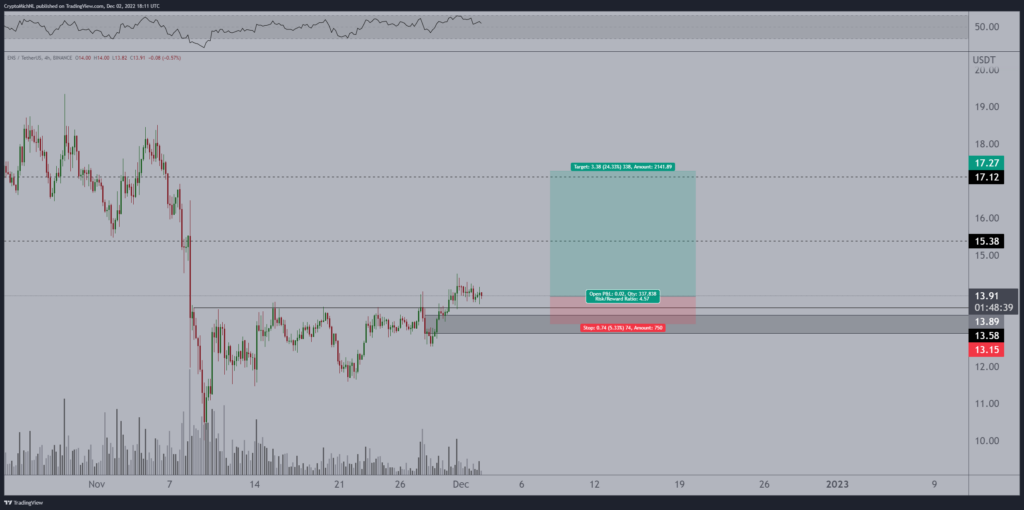
Another altcoin on the investor’s radar is the Ethereum Name Service (ENS). The project allows users to create personalized domain names for crypto addresses. ENS looks good for a rally after turning resistance around $13 into support, according to Van de Poppe. For this altcoin, the analyst also shares the following predictions:
A break above $13 and now a resistance against a support turn. It’s probably on its way to continuing. Then I’ll be targeting $15.40 and $17.
 Source: Van de Poppe/Twitter
Altcoin projects that the analyst likes to perform
cryptocoin.comMichael van de Poppe, whose forecasts and analyzes we have included, states that some altcoins are showing strength as decentralized finance wakes up.
Slowly, but surely, some #altcoins are showing strength and especially #DeFi is waking up.
— Michaël van de Poppe (@CryptoMichNL) December 4, 2022
The analyst shares this as a follow-up to his previous tweet, where he highlighted FTM, AVAX and DOT performing well. Van de Poppe tweeted:
Now AVAX and DOT are starting to look pretty good as FTM is making a significant debut.
Technical view of FTM, AVAX and DOT
Crypto analyst Chryzano Ariston evaluates the performances of FTM, AVAX and DOT. Phantom (FTM) ranked ninth among the top earners according to CoinMarketCap. The altcoin is up 5.00% in the last 24 hours and is trading at $0.252886. FTM did a roller coaster ride. Over the past month, FTM has recorded a maximum price of $0.3147 on November 5.
However, prices fell as low as $0.1675 within a few days. Interestingly, the 50-day MA from the upside seems to converge with the 200-day MA, indicating a possible bottom. It is also possible that this will cause an uptrend. Accordingly, FTM is likely to aim to hit resistance 1. On the contrary, if this (golden cross) does not happen and the bears take control, FTM is likely to drop to Support 1. Also, if the bears continue to push, FTM lands at Support 2.
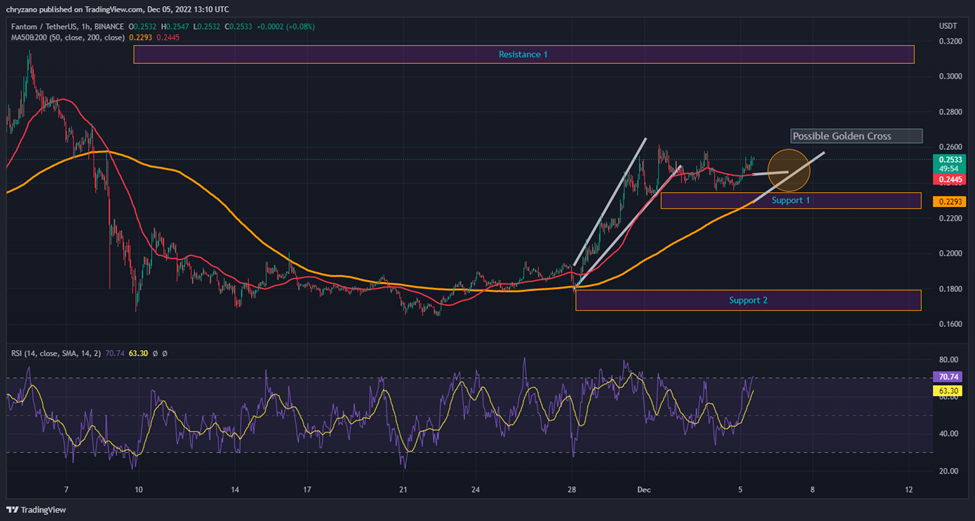 FTM 1-hour trading chart / Source: TradingView
Avalanche (AVAX), on the other hand, is trading at $14.01 and is up 2.09% in the last 24 hours, according to CoinMarketCap. Meanwhile, AVAX has been in a bull run since 28 November. Also, AVAX’s RSI is at 49.49, which indicates that the trend is well established and the uptrend is likely to continue. In addition, the 50-day MA (red line) points to more potential. Also, the 200-day MA (yellow line) seems to have gained some momentum after a lethargic sideways move.
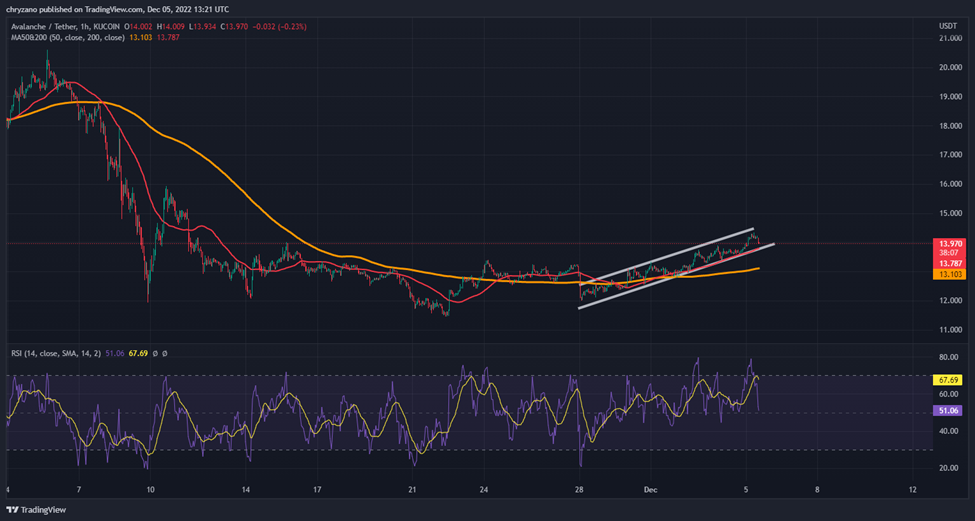 WAX 1-hour trading chart / Source: TradingView
Polkadot (DOT) has been flat since November 10. According to CoinMarketCap, at the time of writing, the price of DOT is up $5.64, up 2.00% in the last 24 hours.
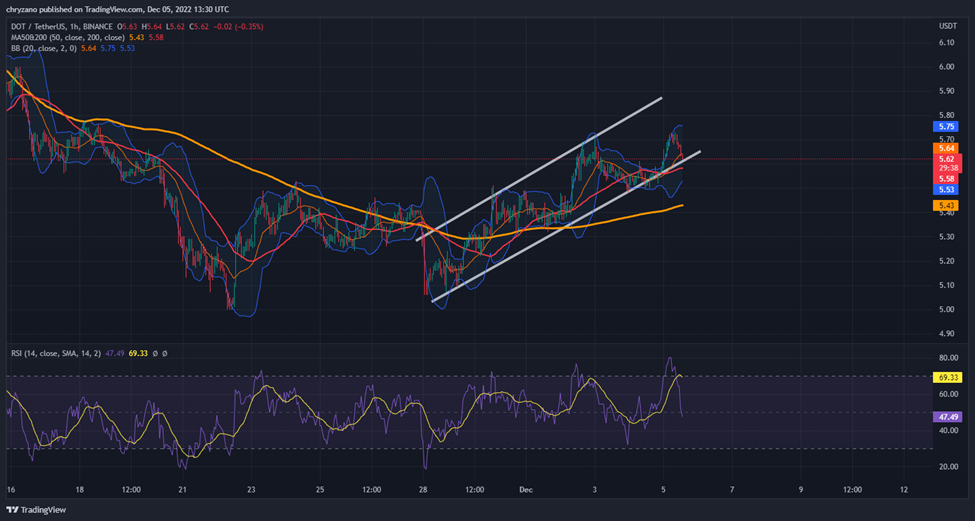 DOT 1-hour trading chart / Source: TradingView
According to the chart, DOT is going through a bull run. As it marks the 50-day MA (Red line) and the 200-day MA (yellow line), they are placed parallel to each other. And the RSI is at 49.78, which indicates that the trend will continue.