In this article, we have compiled for you how things are going on the Litecoin side.
While Litecoin is not yet close to its former highs, it is giving some unpromising signals for investors. We have compiled these data in the light of the market.
Litecoin Price Analysis
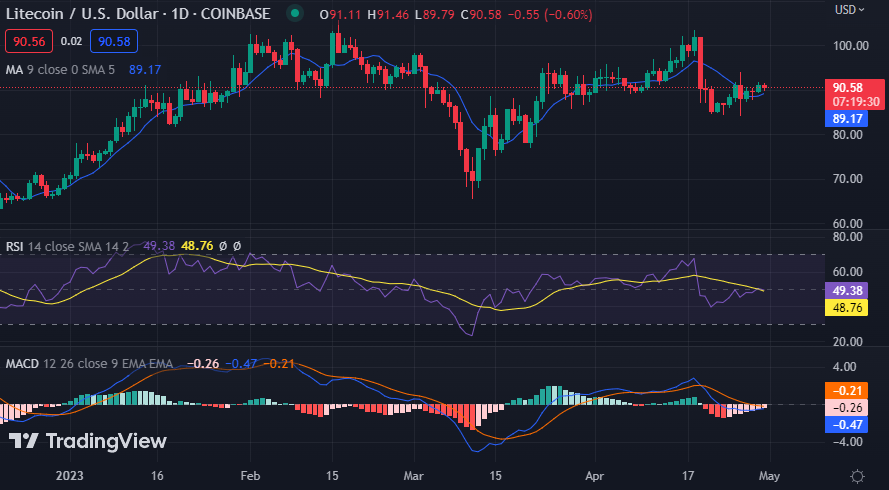
The Litecoin chart shows that the crypto asset is on a downward trajectory for most of today’s session as bears push the price towards the $90.00 level.

On the daily chart, Litecoin shows bulls holding LTC above the $91.39 resistance. However, the trades experienced today again revealed the selling pressure in Litecoin. Sell Currently LTC is trading at $90.71, which is relatively higher if we compare it to the moving average (MA) of $89.17.
The MACD indicator is currently bearish, indicating that the bearish momentum will likely continue if the buying pressure fails to break the $91.39 resistance level. On the histogram, the red bars have shrunk in size and also lost momentum, so the bulls are gaining the upper hand, indicating they are on the way. The RSI indicator is in the neutral zone at the index level of 49.38, which indicates that the market may consolidate in the near future.


