
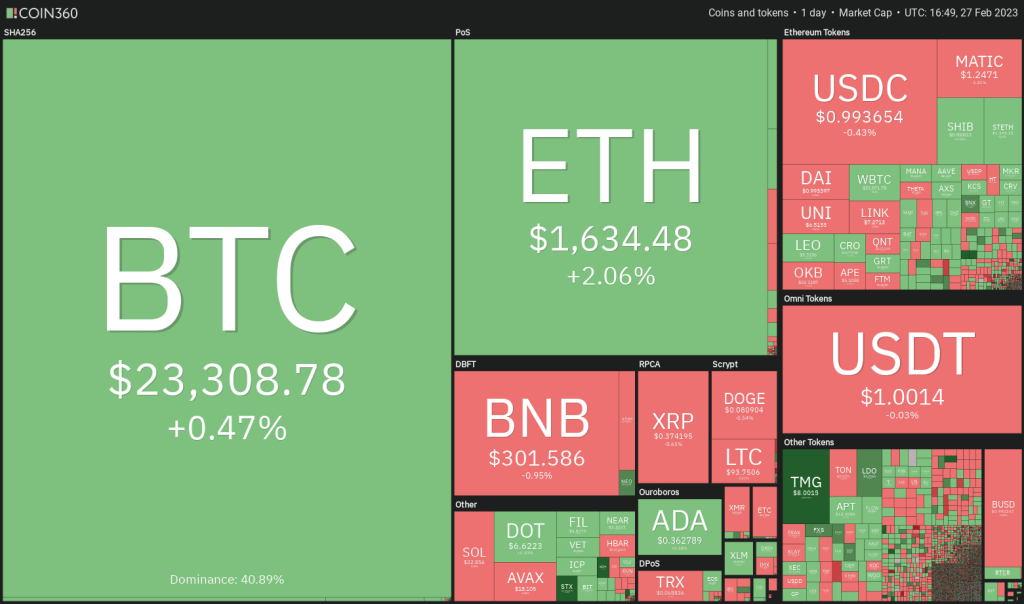
MATIC, DOGE and these 6 coins are trying to recover, but selling at overhead resistance may continue to suppress the bullish momentum. cryptocoin.comWe have compiled the buy-sell strategies determined for you.
They are skeptical in the short term
Bitcoin and US stock markets are trying to start the week on a positive note, but some analysts are skeptical about the markets’ short-term prospects. According to Bloomberg Intelligence senior macro strategist Mike McGlone, Bitcoin will face significant resistance at $25,000. McGlone believes ‘it may take some time for the take-and-hold types to gain the upper hand’.
Also, Bitcoin whales, unique assets with 1,000 BTC or more, do not seem to be convinced of the recovery in the crypto markets. Bitcoin whale counts have dropped to 1,663, well below the peak of 2,161 in February 2021, according to Glassnode.
It’s hard to hit the bottom in any market. This is why traders should try to build a portfolio when they believe the downtrend has ended and a fundamental pattern has begun.
Rather than buying the entire amount at once, they can gradually build up a portfolio and aim to finish the purchases before the asset gains momentum and rises.
Strategies for MATIC, DOGE, BNB and 5 Coins
SPX
The S&P 500 (SPX) index dropped below the 20-day exponential moving average or EMA (4.046) on February 17, intensifying the selling and pushing the price to the uptrend line. Although the bears pulled the price below the uptrend line on Feb. 24, lows have lured purchases as seen from the long tail of the day’s candlestick. This helped the index close near the uptrend line.
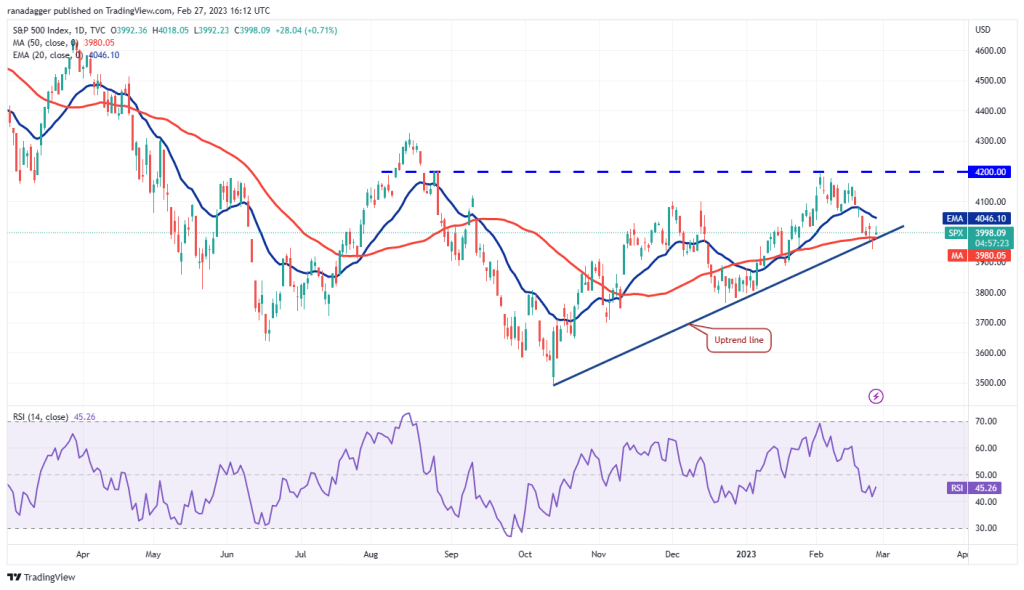
As seen from the long wick on the February 27 candlestick, the bulls may face a challenge as the bears are likely to sell on any relief rally near the 20-day EMA. If the price turns down from the 20-day EMA, this will indicate that sentiment is negative and traders are selling on minor rallies. A close below the uptrend line could open the doors for a possible downtrend to 3.764.
If the bulls want to recover the situation, they will have to push the price above the 20-day EMA. If they do, it will indicate that the break below the uptrend line could be a bear trap. The index could then attempt a recovery towards the overhead resistance of 4,200.
DXY
The bulls successfully defended a retest of the breakout from the wedge formation, which started a stronger relief rally on the US Dollar Index (DXY) on Feb. 20.
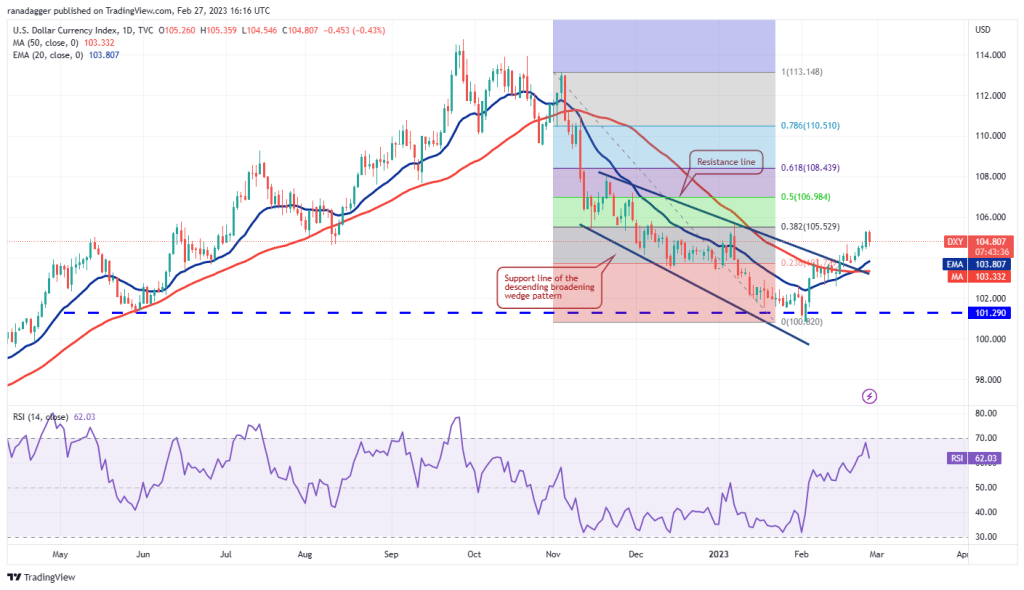
The index has reached the 38.2% Fibonacci retracement level of 105.52. This level could see the bears attempt to stop the recovery. If the sellers want to hold on, they will have to drive the price below the moving averages.
On the other hand, if the bulls want to strengthen their position, they will have to push the price above 105.52. If they manage to do so, they could extend the index recovery to the 50% retracement level of 106.98 and then to the 61.8% retracement level of 108.43.
BTC/USDT
Bitcoin recovered from the $22,800 support on February 25 and broke above the 20-day EMA ($23,417) on February 26. This suggests that lower levels are attracting buyers.
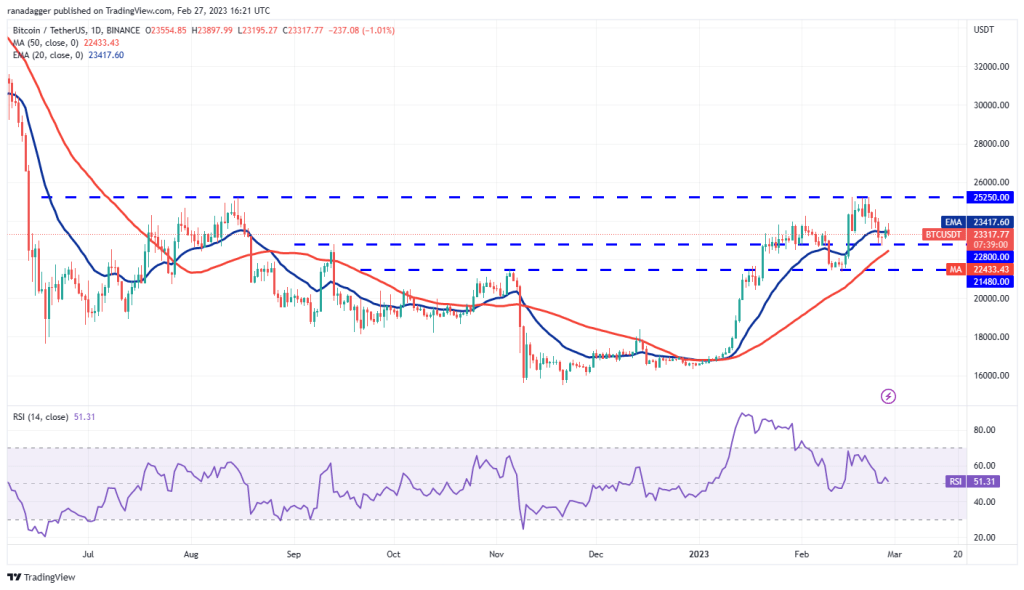
But bears may not give up easily. They will try to push the price below the 20-day EMA and challenge the 50-day simple moving average or SMA ($22,433). If this level collapses, the BTC/USDT pair could drop to the next major support at $21,480.
Alternatively, if the price bounces off $22,800 once again, it will signal that buyers are fiercely defending this level. This could indicate a range-bound action between $22,800 and $25,250 for a few days.
ETH/USDT
Ethereum recovered from the 50-day SMA ($1,587) on Feb. 25, indicating that the bulls are fiercely defending this level. The 20-day EMA ($1,626) has flattened and the RSI is just above the midpoint, indicating an equilibrium between supply and demand.
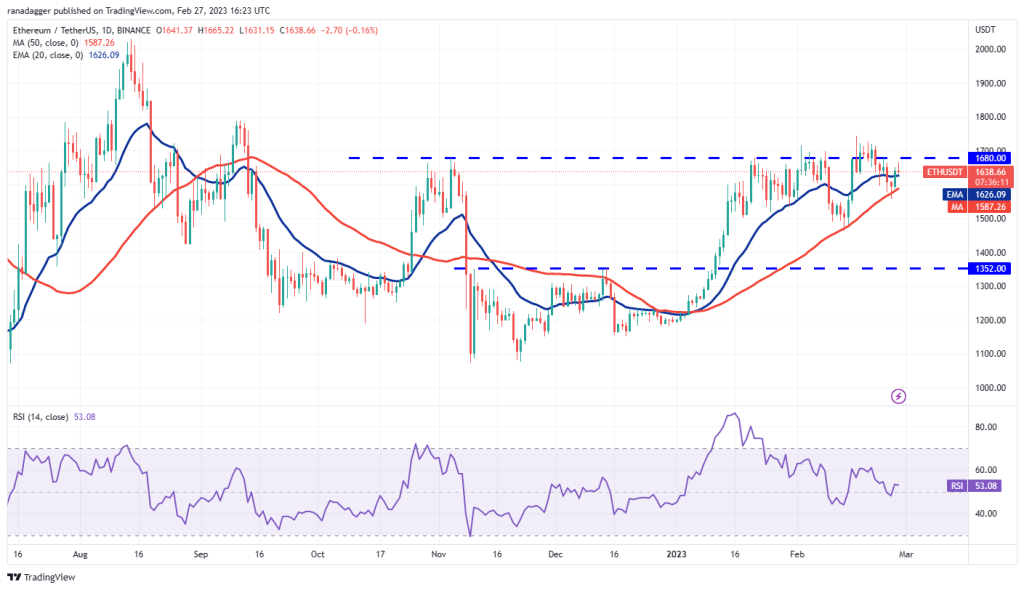
This balance will turn in favor of the bulls if it pushes the price above $1,680 and closes. The ETH/USDT pair will then attempt to break above the $1,800 resistance and begin its journey towards the psychological level of $2,000.
Alternatively, if the price breaks down from overhead resistance once again, it will indicate that the bears are not willing to give up. This could increase the probability of a break below the 50-day SMA. The pair could later decline to $1,460 and later to $1,352.
BNB/USDT
BNB broke and closed below the 50-day SMA ($307) on Feb. 24, but the bulls bought the dip and pushed the price to the 20-day EMA ($309) on Feb. 26. This level attracts bears selling.
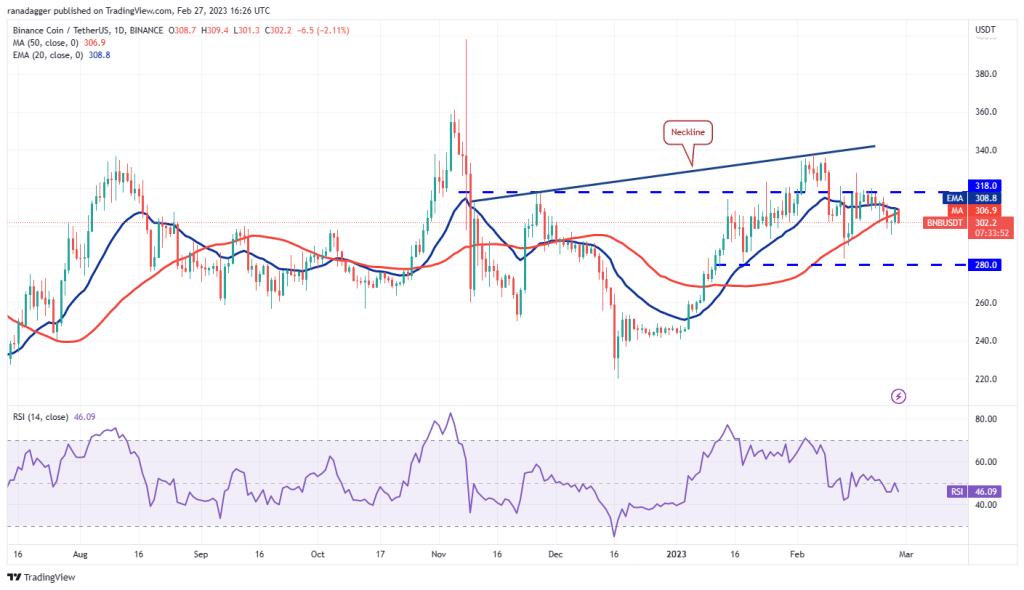
If the price drops and dips below $295, it will show that sellers have turned the 20-day EMA into resistance. The BNB/USDT pair could then decline towards the critical support at $280. This is an important level to watch out for because a bounce could signal a range formation between $280 and $318 for a while.
In the short term, the next trend move could start if buyers push the price above $318 or if the bears push the price below $280.
XRP/USDT
XRP price has been fluctuating in a wide range between $0.30 and $0.43 for the past few weeks. The price broke below the 50-day SMA ($0.39) on February 23 and is gradually falling towards the solid support at $0.36.
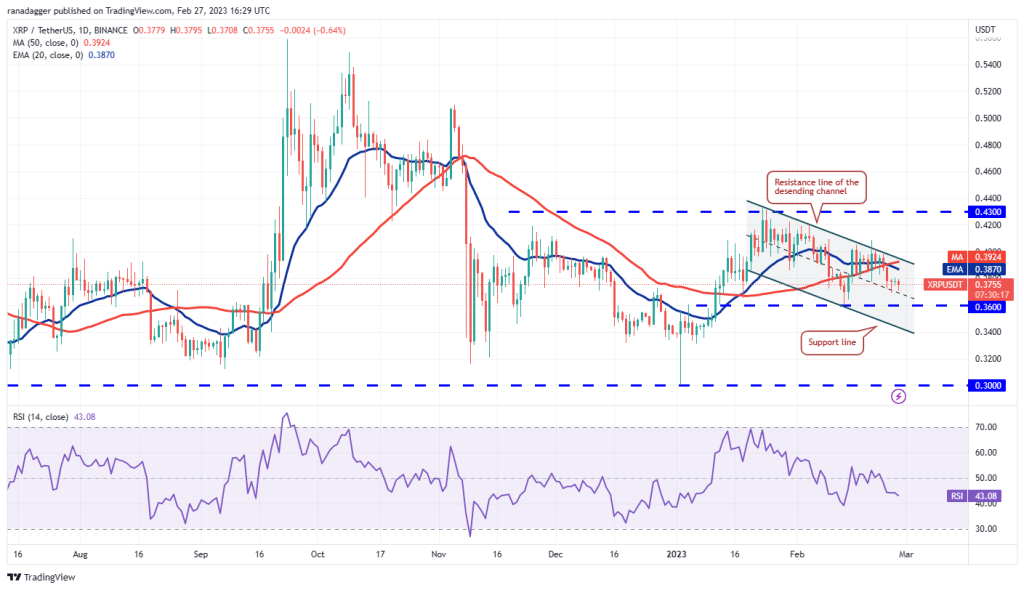
The 20-day EMA ($0.38) has started to drop and the RSI is in the negative territory, suggesting that the bears have a slight advantage in the near term. If the price breaks below $0.36, the XRP/USDT pair could slide to the support line of the descending channel.
This negative view could be invalidated in the near term should the price rise and break above the channel. The pair could then attempt a rally towards the overhead resistance at $0.42, where the bears are expected to build a strong defense.
ADA/USDT
Cardano (ADA) bounced off $0.35 on Feb. 25, but the recovery faces selling at the 50-day SMA ($0.37). This shows that the bears are trying to turn the level into resistance.
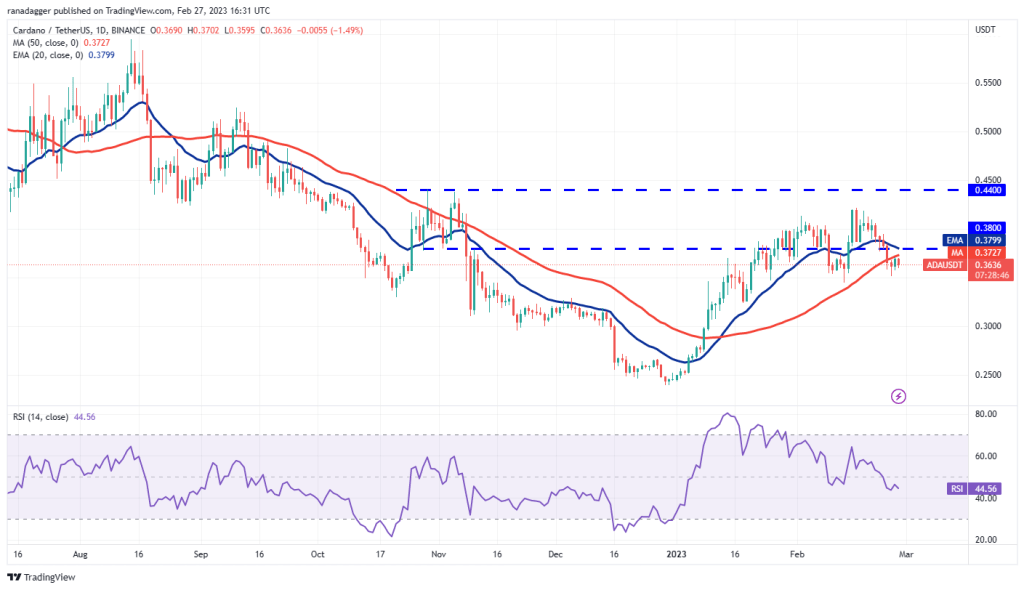
The moving averages are on the verge of a downtrend with the 20-day EMA ($0.38) falling below the 50-day SMA. Such a move will show that the bears have the advantage in the near term. A break and close below the strong support zone between $0.34 and $0.32 could start a decline towards $0.26.
If the bulls want to avoid the downtrend, they will have to push the price back above the 20-day EMA. The ADA/USDT pair could then climb the $0.42-0.44 resistance zone.
DOGE/USDT
Dogecoin bounced off the strong support near $0.08 on February 25, but the recovery faced selling pressure from the bears on February 27.
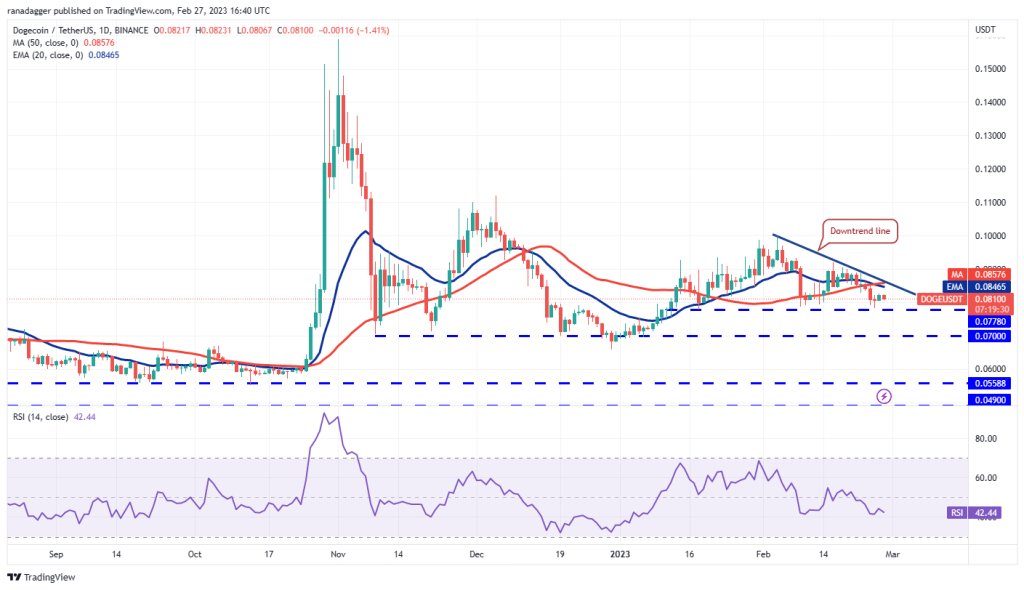
The moving averages have completed a bearish crossover and the RSI is in the negative territory, suggesting that the bears have the upper hand. A break and close below the $0.08 support will complete a head-and-shoulders pattern in the near term. The DOGE/USDT pair could drop to $0.07 later.
Contrary to this assumption, if the price rises from the current level or $0.08, it will indicate that lower levels are viewed as a buying opportunity. The relief rally could face selling near the downtrend line, but if the bulls break this hurdle, the pair could attempt a rise to $0.10.
MATIC/USDT
Polygon (MATIC) fell below the 20-day EMA ($1.30) on Feb. 24 and the bears successfully retested Feb. 26. This shows that the 20-day EMA acts as the new roof.
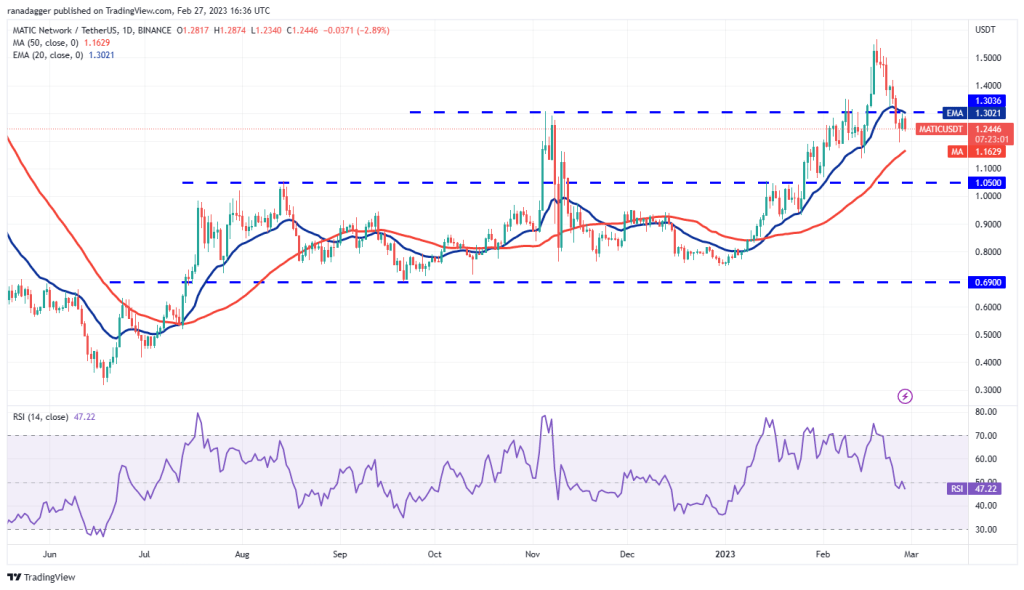
The bears will then try to push the price below the 50-day SMA ($1.16). If they are successful in this effort, selling could intensify and the MATIC/USDT pair could drop to the next strong support at $1.05.
If buyers want to regain the edge, they will have to push the price above the 20-day EMA. This will indicate solid buys on dips. The MATIC pair could climb to $1.42 first and then rally to the $1.50 to $1.57 resistance zone.
LEFT/USDT
Solana is witnessing a tough battle between bulls and bears near the 50-day SMA ($22.75). This indicates that the bulls are trying to hold the level and the bears are trying to break the level and reach the top.
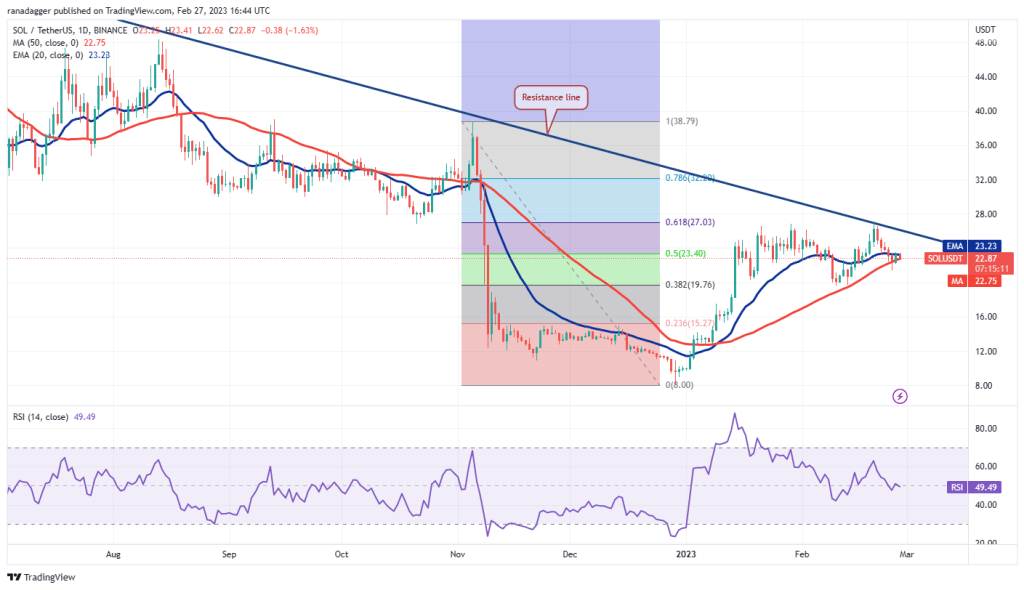
If the price dips below $21.41, the SOL/USDT pair could decline to the key support at $19.68. This is an important level for the bulls to defend, as a close below it could increase selling pressure and drop the pair to $15.
Conversely, if the price rises and rises above the 20-day EMA ($23.23), the bulls will push the pair to the resistance line. The bears will likely defend this level with all their might, but if the buyers break this hurdle, a rise to $39 is possible.


