Bitcoin, the largest cryptocurrency, also leads the market. Recently, a selling move by BTC miners has attracted attention. That’s why investors are wondering about the latest situation in BTC. Here are the sales moves of BTC miners and what is expected for crypto money…
Bitcoin miners sold 1,000 BTC
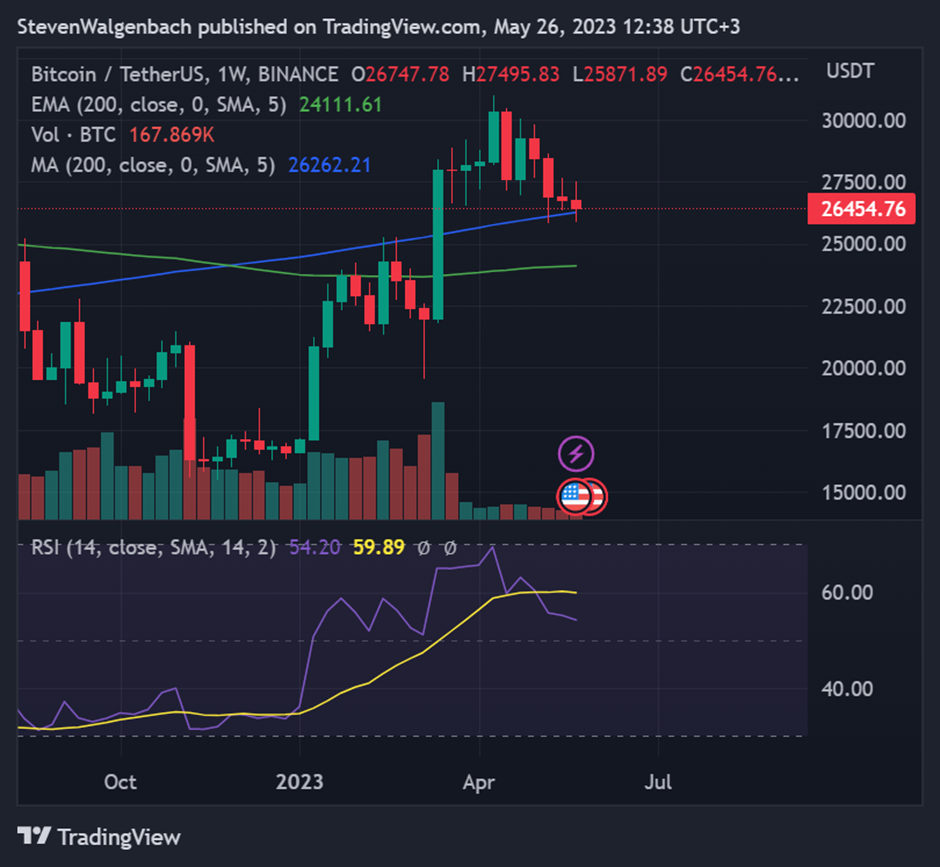
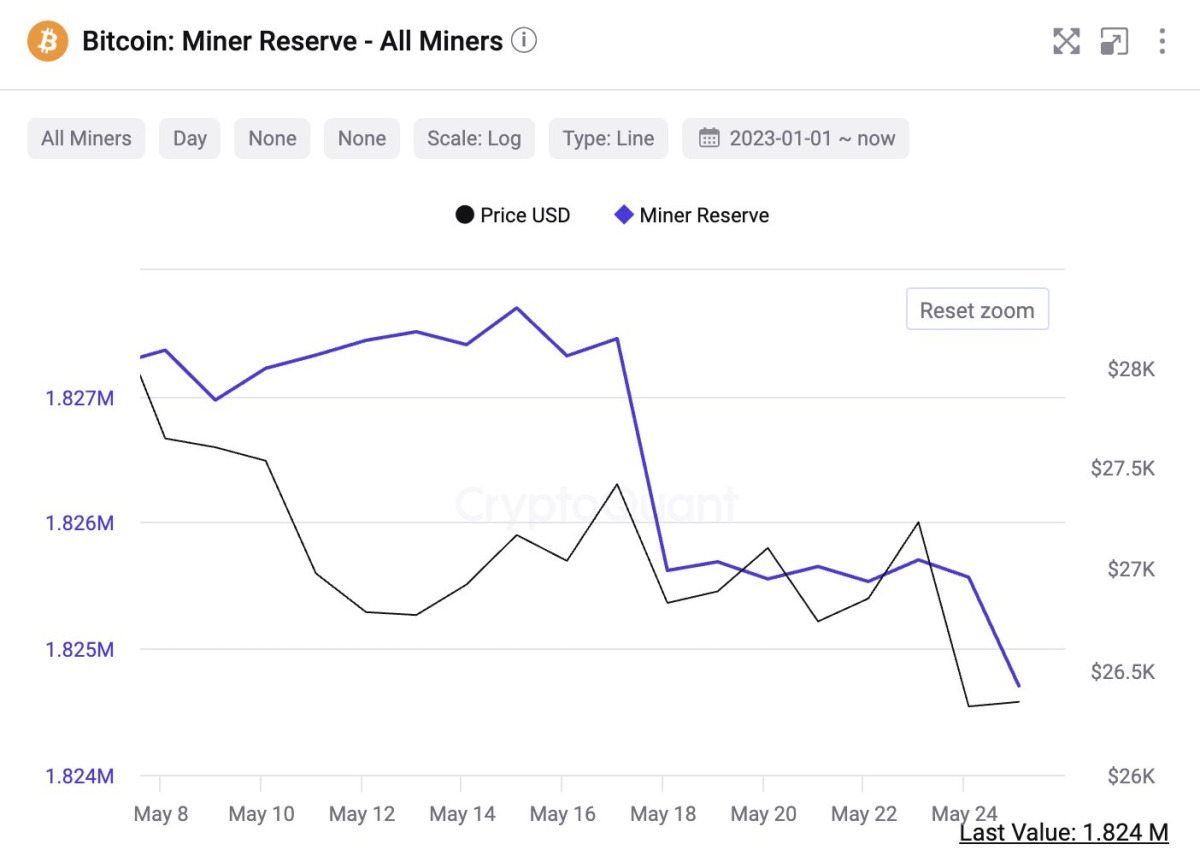
Bitcoin price is struggling not to drop below $26,000. This has caused miners to sell their reserves to avoid further losses or to continue powering their systems. These miners sold around 1,000 BTC worth close to $27 million in 24 hours. Currently, the US debt ceiling is cited as the main reason for the crypto price recovery stalling. As the Biden administration and Republicans continue to speak up and find common ground, the market suffers from fears of default.
The NASDAQ 100, which appeared unaffected by adverse macroeconomic conditions, rose 2.46%. It reached a 13-month high of 13,938. This rise was led by Nvidia (NVDA), whose stock prices rose by about 24.37 percent, trading at $379.80. NVDA’s total earnings on May 25 are four times the amount remaining in the US Treasury’s cash balance of approximately $49 billion. Seeing this stellar rise, the crypto community is questioning why Bitcoin has not found the liquidity to benefit from such an increase.
This was voiced by analyst CrediBULL Crypto. However, the market still needs encouragement from institutional investors and whales, as individual investors still act with fear and caution and pull back at the first issue. Also, Bitcoin whales have long been seen as the trigger of a bull cycle.
Michael van de Poppe: Bitcoin will soon hit $38,000
On the other hand, in a recent market analysis, Michael van de Poppe explored the potential impact of interest rate pauses and key resistance levels on the future of Bitcoin (BTC). Van de Poppe predicted in his video that the price of BTC could rise above $ 38,000 in the coming weeks. According to the analyst, the latest FOMC meeting minutes hinted at the possibility of interest rate pauses. He predicted that pauses could happen at the next meeting or the one after that, which could potentially feed the crypto market. This is because a pause in interest rates is often viewed as a positive for market sentiment.
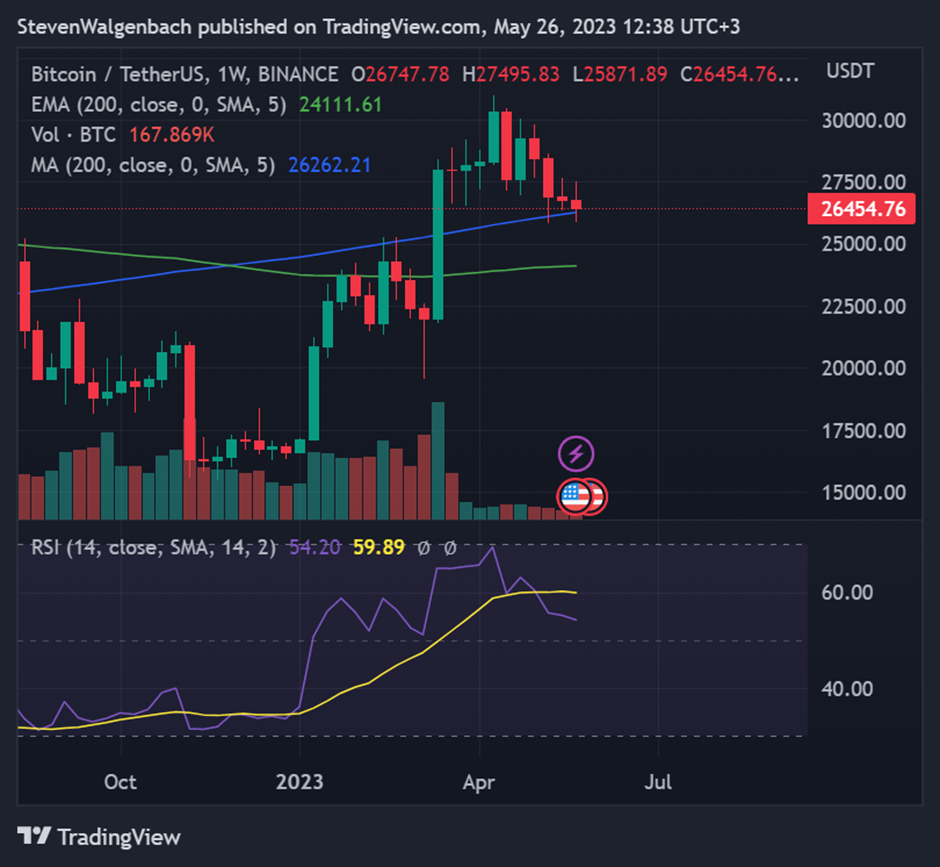
Meanwhile, Van de Poppe emphasized the importance of the 200-week Moving Average (MA) and the 200-week Exponential Moving Average (EMA) below the price of BTC. He also stated that monitoring these levels is very important. In his analysis, he stated that if BTC fails to close this week above these levels, a quick recovery will be necessary for the cryptocurrency to climb to $38.8k. The pace of recovery will be a key factor in determining potential price action. Failure to break above the two lines may cause the price of BTC to drop to $20,000.
Wyckoff: Bitcoin futures also affected
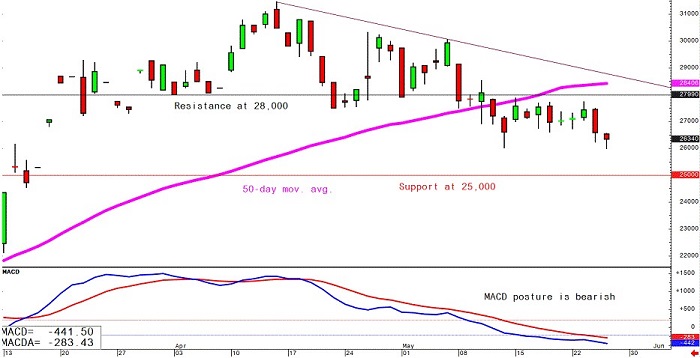
The current decline in Bitcoin price caused June Bitcoin futures prices to drop to a nine-week low overnight, according to senior technical analyst Jim Wyckoff. However, prices stabilized after the US market opened. “The bears have re-established a price downtrend on the daily bar chart,” Wyckoff said. Gained short-term technical advantage. The path of least resistance for prices is now neutral downstream,” he warned.
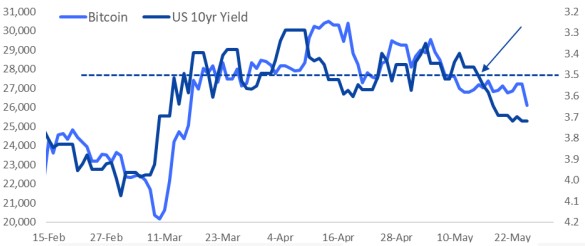
On the other hand, according to Markus Thielen, head of research at Matrixport, “Bitcoin prices are struggling with 10-year Treasury yields rising above the critical 3.5% level.” This figure was previously defined as a signal to take a neutral or short sell position for BTC. Therefore, Thielen said, “We are not surprised by the Bitcoin sale as prices are currently at 3.7 percent. “Investors should patiently wait for yields to lose their upward momentum,” he said. Analyzing the data, Thielen stated that transaction volumes have decreased and as a result, the price of Bitcoin is experiencing downward pressure.
These levels are hidden in the BTC chart
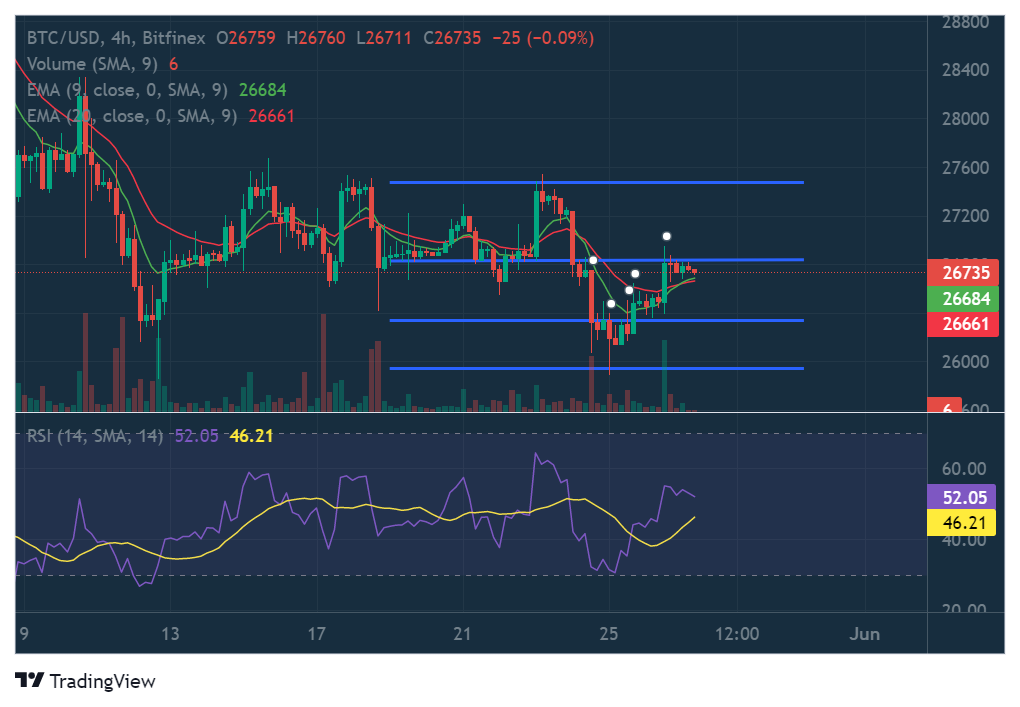
According to a technical analyst, on the 4-hour chart of BTC, the bullish technical pennant was on the verge of triggering as the 9 EMA lines tried to break above the 20 EMA lines. Should this crossover occur, the price of the leading coin could finally turn the $26,850 resistance level into support. This will then open a way for it to rise to the next major resistance at $27,450. This bullish thesis will be confirmed if the price of BTC can close above $26,850 in the next 24 hours. Failing that, the price of BTC is at risk of falling to the next important support at $26,350.
Altcoin Sherpa spooked in anticipation of drop
Altcoin Sherpa, on the other hand, says it follows the Bitcoin (BTC) dominance chart (BTC.D). BTC.D tracks how much of the total crypto market cap is owned by BTC. According to the analyst, if BTC.D stays behind the 48.20 percent resistance, it could lead to rallies in the altcoin markets. However, Altcoin Sherpa warns that altcoins could be crushed if BTC.D breaks as a result of Bitcoin falling towards $25,000.
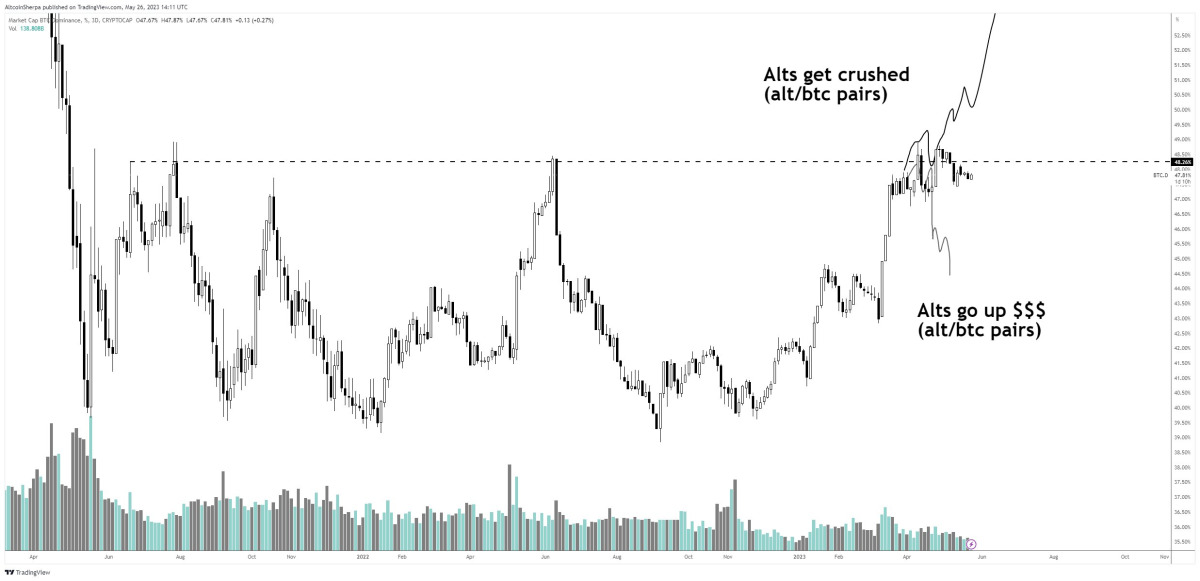
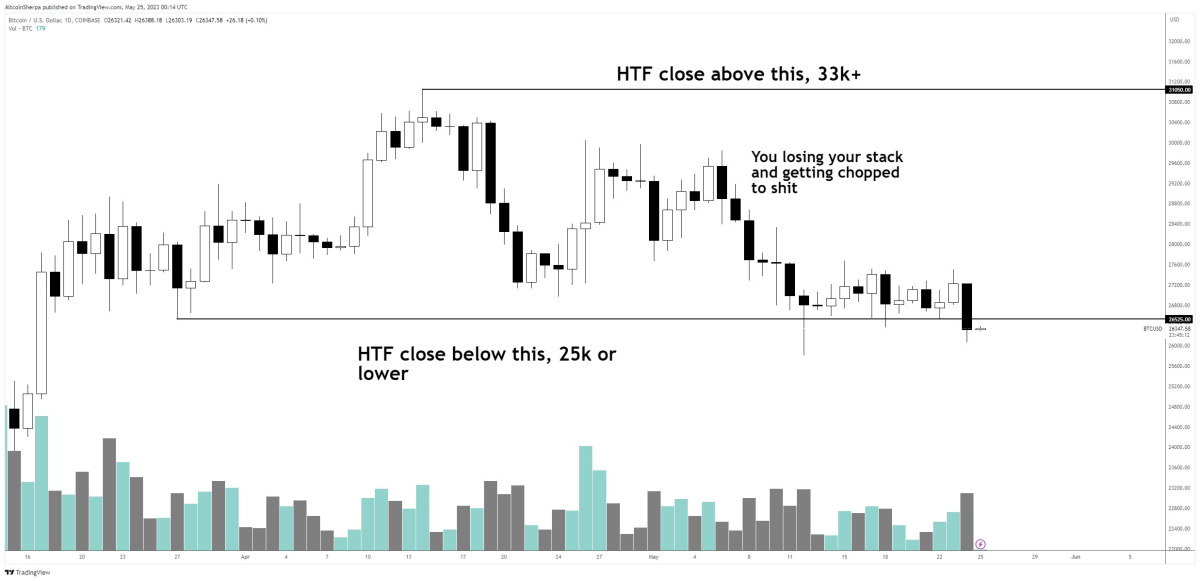
The fact that the BTC.D chart is bearish shows that altcoins are gaining value faster than BTC. A rising BTC.D chart shows that BTC is rising faster than altcoins, or altcoins are depreciating more than Bitcoin. Sherpa also predicts that Bitcoin will retest the $25,000 level if BTC breaks below the $26,525 support on the wide time frame (HTF) chart. Altcoin Sherpa adds that several key technical indicators (200EMA, .382 Fib) converge at $25,000 for Bitcoin. However, it would not be a surprise to see $23,000 if this area is lost, according to the analyst.
The latest estimate points to a 150 percent rise
The last guess is more flighty than the others. Analyst Credible Crypto claims that with a 150 percent rise this year, Bitcoin will set a fresh record. According to Credible Crypto, Bitcoin could replicate previous waves as witnessed in 2020, when BTC struggled for months to break above a key resistance level before hitting all-time highs. The analyst uses the following statements:
I think about where we are now compared to our last impulse [in 2020]. Note that the support/resistance reversal and retest at $10,000 took about three months to complete. Two months later, we hit an all-time high, up 90 percent. Four months from now we hit the top – just six months after completing the support/resistance turn and retesting at $10,000, and over 500 percent higher… Don’t tell me it can’t be done while it’s literally been done before.
