
The crypto market cap has dropped below $1 trillion after the recent FTX debacle. In this decline, the prices of Polygon (MATIC), Cosmos (ATOM), Polkadot (DOT) and Synthetix (SNX) have dropped significantly in the last 24 hours. However, analysts expect further declines for these altcoin projects.
First altcoin Polygon (MATIC)
cryptocoin.com As you can follow, MATIC’s price has dropped by 6.65% in the last 24 hours to $0.9585. Compared to the two crypto market leaders, BTC and ETH, the altcoin weakened by 8.20% and 10.06%, respectively.
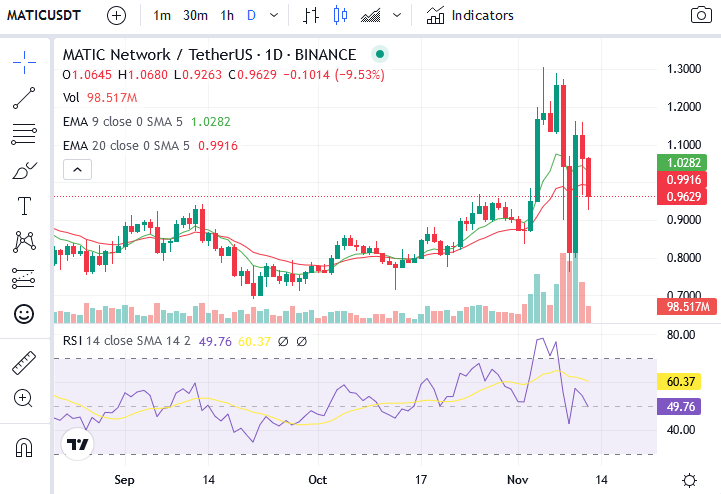 Daily chart for MATIC / Source: CoinMarketCap
The altcoin price is currently trading below the 20 daily EMA line. There has been a lot of volatility in the price of MATIC as it dropped to $0.8152 before rising above $1. However, it fell back to its current level again. However, the relative positions of the 9 and 20 EMA lines on the daily chart for MATIC are showing some bullishness. That means mixed feelings. However, the daily RSI line is located below the RSI SMA lines. Hence, the altcoin is inclined towards the oversold zone.
The second project with a collapse signal is Cosmos (ATOM)
ATOM is trading at $10.99 at press time, after an 8.54% drop in price over the past day. It also weakened by 5.44% and 7.16% against BTC and ETH, respectively.
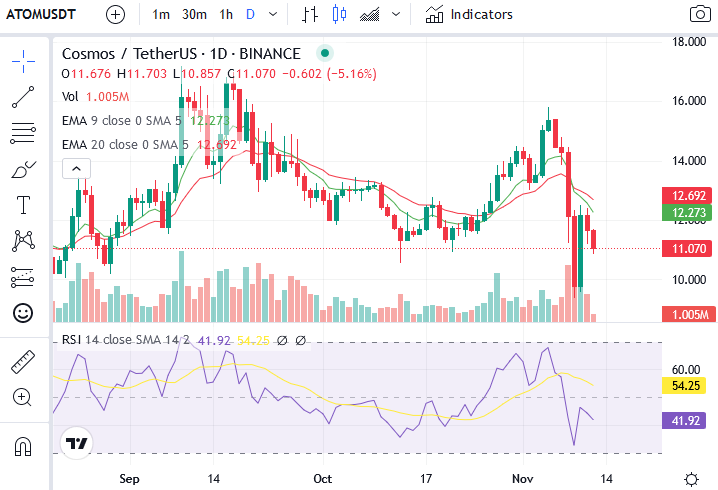 Daily chart for ATOM / Source: CoinMarketCap
ATOM is trading below the daily 9 and 20 EMA lines. Also, last week was both bearish. This downtrend on the EMA line was accompanied by a bearish RSI cross with the RSI SMA line.
Third-ranked altcoin Polkadot (DOT)
The altcoin has seen a 2.09% drop in price over the past 24 hours. After that, DOT is trading at $5.71 at the time of writing. However, the altcoin managed to strengthen by 1.26% against BTC during this time. However, it weakened by 0.87% against ETH.
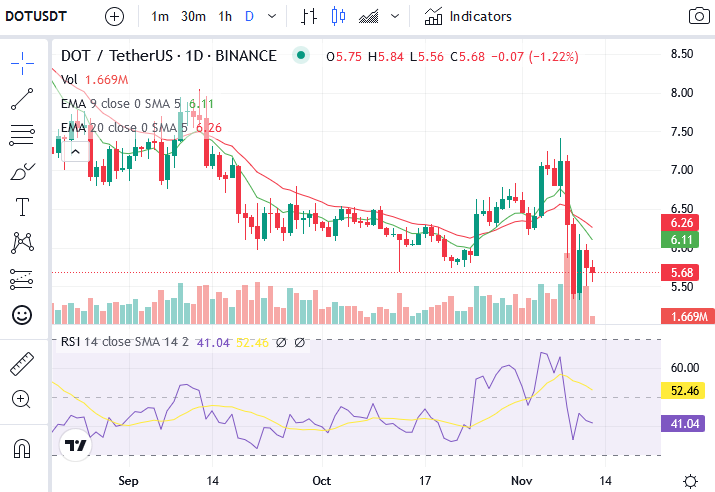 Daily chart for DOT / Source: CoinMarketCap
Similar to ATOM, DOT price is trading below the daily 9 and 20 EMA lines after two lines crossed bearish last week. Once again, the bearish divergence of the daily 9 and 20 EMA lines was accompanied by the crossing of the bearish RSI and RSI SMA.
Synthesis (SNX), the last altcoin to signal bearish
SNX is down 9.66% and is currently trading at $1.74. It also weakened by 6.49% and 8.41% against BTC and ETH, respectively.
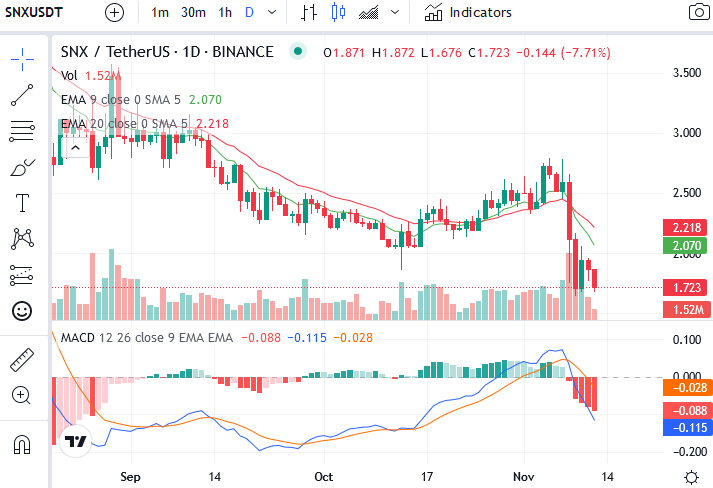 Daily chart for SNX / Source: CoinMarketCap
The daily chart for altcoin price tells a similar story to other altcoins in this article. Because the bearish divergence at the 9 and 20 daily EMA lines triggered a negative impulse to force the altcoin price to trade below the 9 and 20 daily EMA lines. Additionally, the daily MACD and MACD signal lines signaled bearish after crossing the two lines. The gradient of the daily MACD histogram for SNX also has a negative slope over the past 5 days.