A popular analyst says there are certain catalysts that could push Ethereum (ETH) to $10,000 in the next bull market. Analyst Tony M thinks that MANA, which is at the forefront of metaverse coins, is preparing for a bull run. According to Aaryamann Shrivastava, rising greed in the crypto market could trigger a rally in LINK price in this way. Analyst Filip L, on the other hand, states that Hedera Hashgraph has a repetition pattern that can bring serious profits.
“Two catalysts could drive ETH boom to $10,000”
Popular analyst Guy Turner says a crypto game-changing ‘killer app’ could be what pushes a massive Ethereum rally to the five-digit mark. In this context, the analyst makes the following statement:
Beyond Bitcoin and Ethereum, I think for the broader crypto market, which is something like a killer practice… We’re very close to the beginning of the journey in terms of what crypto can do and what people working in crypto can do. So we might see a killer app come along and really boost a certain industry, maybe something like GameFi or like the metaverse.

But the analyst says something less exciting could also act as a catalyst for crypto. He suggests that the launch of a new central bank digital currency (CBDC) from a major country could also push people to adopt crypto. In this regard, he makes the following assessment:
I think another catalyst for a bull market could be something more mundane. I think it could be something like the introduction of CBDCs… I think all it takes is for a major economy to issue a CBDC, issue one of these central bank currencies and have crazy limitations on how much or where you can spend it, and people will definitely see that.
“Mana, which is at the forefront among metaverse coins, is taking action”
Decentraland (MANA) price rose 3% on the day, maintaining a shallow consolidation within the newly established uptrend that started on Jan. At the time of this writing, MANA is up 155% since the start of the new year. The MANA price is currently at $0.74 in auctions. There is a spiral pattern located on smaller time frames between the 8-day exponential and 21-day simple moving averages. This pattern is usually formed before a volatile price move.
The Relative Strength Index (RSI), an indicator used to measure the strength of an uptrend, shows that MANA price is indeed in an uptrend. This was noted as the daily time frame entered general conditions after tagging the $0.68 zone on Jan. 18. Additionally, there are bullish divergences at $0.70 as the RSI turns back to the 40 to 50 support zones. Overall, the techniques support the bullish trend for MANA popular among metaverse coins. This indicates that MANA could create another move to the upside. A break above the $0.75 swing point will likely cause another rally to challenge the monthly top of $0.84. It will also lead to a buying frenzy targeting the $1.00 price zone.
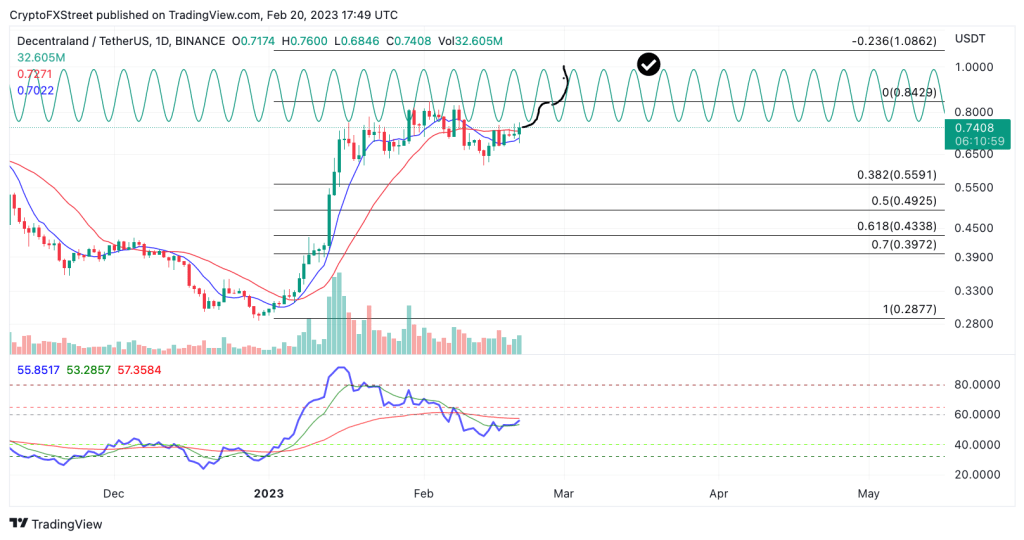 MANA 1-day chart
However, a breach below the current low of $0.66 could invalidate this bullish scenario. If the level is tagged, the bears could push the resistance zones within the uptrend down to the $0.50 region, causing a selling frenzy. Bearish scenario will pave the way for a 30% decline.
“LINK price is on the way up”
cryptocoin.com As you follow, Chainlink price has managed to make significant gains over the past few days. With an increase of around 22%, LINK follows the lead of the broader market as investors are showing an upward trend. The Crypto Fear and Greed Index shows that the market is experiencing increased greed, which may imply that the recent bullish continuation. This view is supported by the Moving Average Convergence Divergence (MACD) indicator, which shows a bullish crossover that occurred a few days ago. The MACD line (blue) crossing the signal line (red) is proof of this.
If LINK price observes positive momentum and the altcoin breaks and turns its immediate resistance at $8.27, it will also convert the 78.6% Fibonacci retracement of the $8.94 to $5.76 move into a support base. This will give LINK the support it needs to recover towards its nine-month high of $9.33. This price level also marks critical resistance for the altcoin, and turning it to support would allow the cryptocurrency to surge 23% to $10.00.
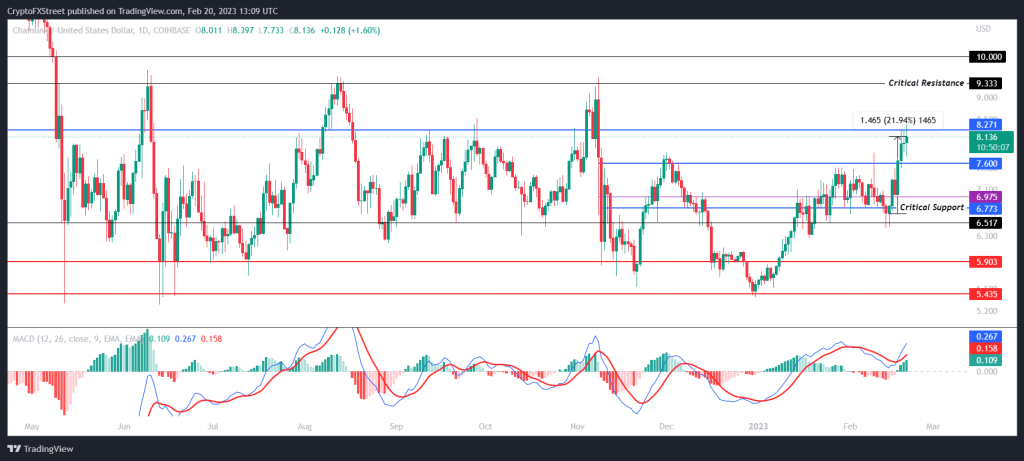 LINK 1-day chart
However, the Relative Strength Index (RSI) is approaching the overbought zone above the 70.0 mark. If it enters this zone, it indicates a pullback for LINK price until the market cools off. Thus, LINK can dive to test the immediate support at $7.60. Losing this level would push the price towards the critical support of $6.77, the confluence of the 50-day and 100-day Exponential Moving Averages (EMA). If the chainlink falls below these, it will invalidate the bullish thesis and cause it to drop below $6.
“HBAR trades higher with a fixed pattern”
Hedera Hashgraph has wind in its sails and the price action on the charts confirms this. The rising RSI not only proves that the bulls are buying relentlessly on the price action, but the Golden Cross supports the situation HBAR is currently in. Bulls who want to be part of the price action need to spot this pattern to enter it safely and see the price action go higher.
HBAR sees the bulls forming a short-term ascending trendline between seven and ten trading days at a time. The bulls can enter three or four days later when the trendline becomes clear and stay in the trade until it rises. The first take profit level comes in at $0.11, the January 29, 2021 high, and ultimately at $0.13 near the monthly R3 resistance level for February.
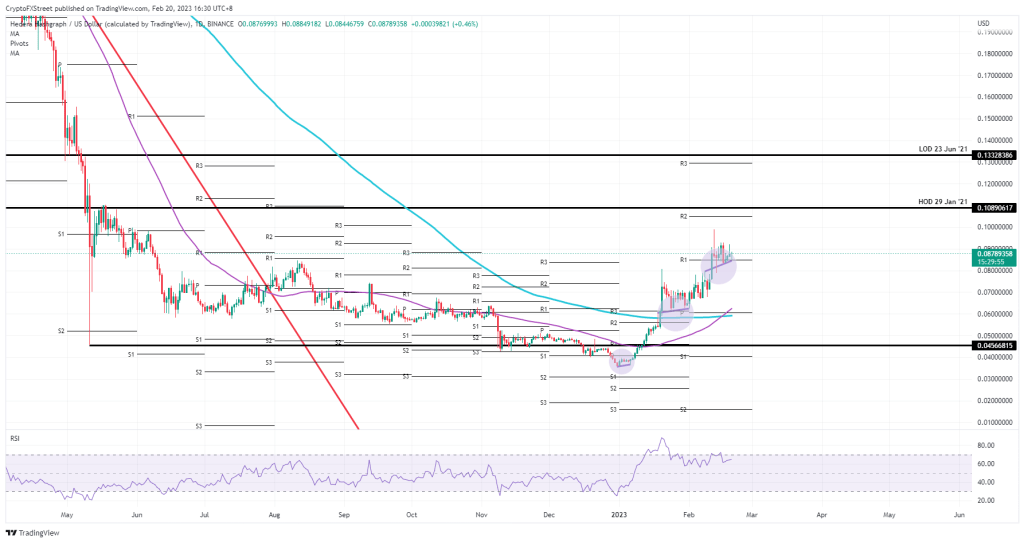 HBAR daily chart
If such a rising short-term plateau is broken, we could see a short sell to the previous level each time. For example, if the current plateau is broken, it is possible for price action to drop by around 20% to $0.065, where support from the previous plateau kicks in. If one breaks due to a major negative catalyst, expect the 55-day SMA to be around $0.06.