
According to crypto analyst Akash Girimath, DOGE is approaching the 20 percent breakout. However, the analyst says that the AVAX price is preparing for a trend reversal. Analyst David, on the other hand, expects a strong rise in FXS. Crypto analyst Christian Encila also notes that AVAX is showing signs of fatigue. The analyst expects a rise in the UNI price.
DOGE price sets the stage for a choppy move
Dogecoin price has been producing lower highs and lower lows since April 3rd. When we combine these ups and downs, a descending trend line emerges. DOGE lost 50% of its market value between April 3 and June 9. It also made a local bottom at $0.0530. Since then, DOGE has rallied 28%, starting a recovery move. Thus, it came face to face with the descending trend line mentioned above.
A successful break above this resistance level will confirm that DOGE price has started a volatile move. In such a case, DOGE could covet liquidity holding above the equal highs of $0.0721. If the bullish momentum continues, DOGE price could see the next hurdle at $0.0814. Altogether, this move will yield a 20% gain from the current position of $0.0673. Interested investors should also pay close attention to the $0.0631 support level, which is a good buying opportunity in case DOGE pulls back before attempting a breakout.
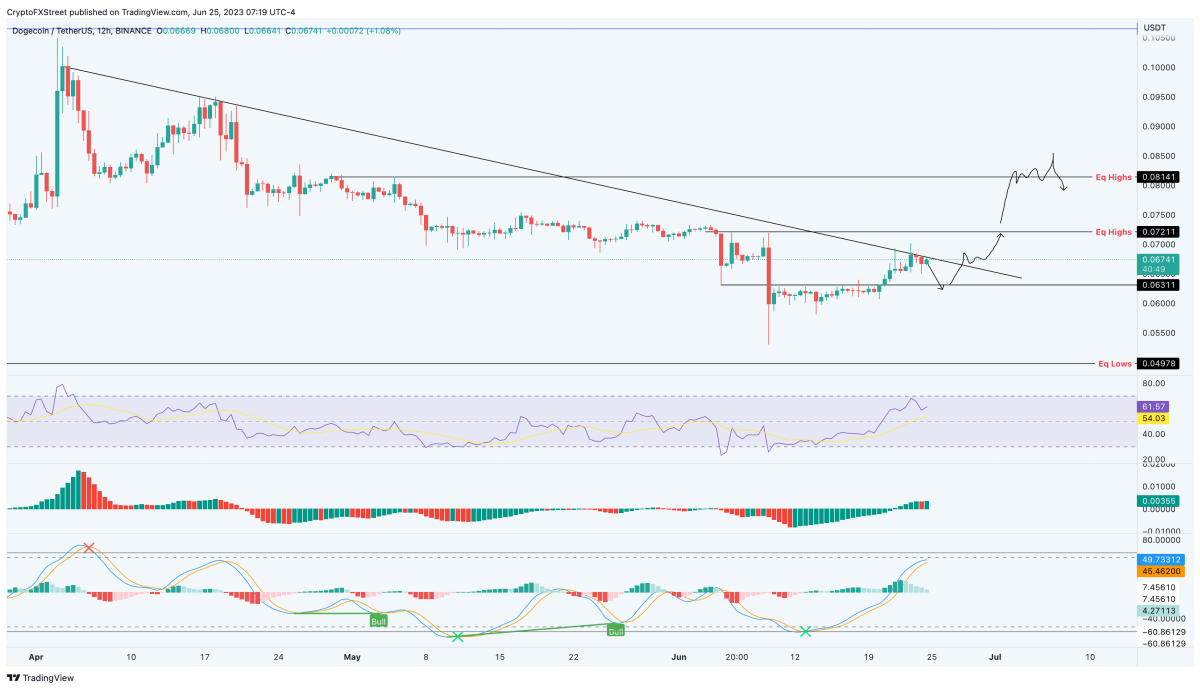 DOGE 12 hour chart
While the bullish outlook is a medium to long-term thesis, a daily candlestick close below $0.0631 will turn it into a resistance level, invalidating the bullish thesis for DOGE price. In this case, the DOGE price is likely to drop by 21%. In this case, it is likely to wipe out any remaining liquidity below the equally low $0.0497 level.
AVAX price prepares for trend reversal
Altcoin price gained 40% between 10-25 June. Thus, it created a range extending from $9.65 to $14.25. As AVAX comes close to retesting the top of the range, signs of exhaustion are getting clearer with each passing hour. Between June 21 and 25, AVAX price formed three distinct highs. However, over the same time period, the Relative Strength Index (RSI) and the Awesome Oscillator (AO) peaked lower.
This dissonance is called the “bearish divergence” and indicates that the momentum is not behind this recent upswing. A technical pattern is a sell signal and usually leads to a correction in the underlying asset. For AVAX price, the correction will likely drop the altcoin by 11%. In this case, it will label the midpoint of the aforementioned range at $11.95. This move is an excellent opportunity for shorts who will profit from this 11% move to the downside.
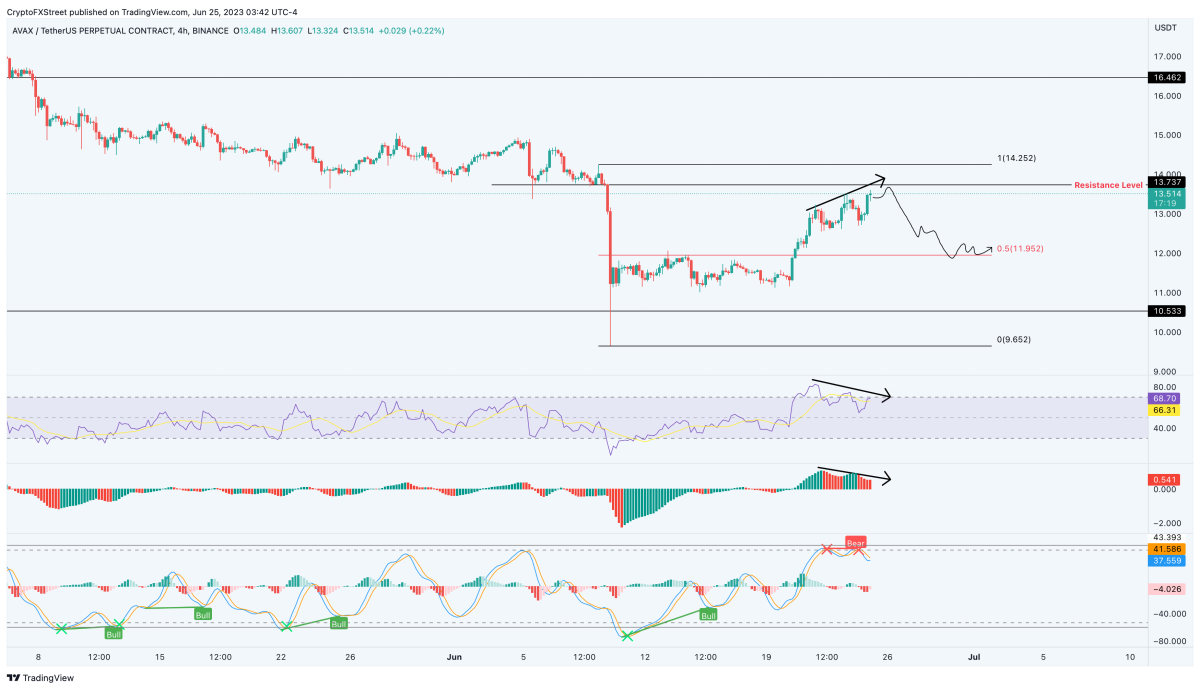 AVAX 4-hour chart
Despite the recent recovery rally, AVAX price showed multiple sell signals that made sense. The bearish thesis makes sense, as short-term sellers book profits. But if the Bitcoin price continues to rise at the start of a new week, things could turn ugly for the bears. In such a case, a four-hour candlestick closing at $14.25 would invalidate the bearish thesis for AVAX price. This development is likely to cause the altcoin to attempt to retest the $16.46 barrier.
Like DOGE, FXS has upside potential
Frax Share (FXS) price hit a year high of $14.2 on February 9. However, it has since been trading within a descending parallel channel. It formed long wicks, although there were a few instances where the price went out of the channel. Also, it quickly bounced back into the channel (yellow ellipses). The descending parallel channel is considered a bullish pattern that leads to breakouts in most cases. On June 15, FXS price bounced strongly from the support line of the channel (green arrow). Thus, it is currently approaching the midline of the channel.
The daily RSI indicator broke above the resistance line. Such breakouts in the RSI indicator often lead to similar breakouts in price action. Given that FXS is trading inside a bullish pattern and there are bullish signals on the RSI indicator, it is likely to break above the middle line of the channel and move towards the $7.9 resistance line. This marks an increase of over 30% from the current level.
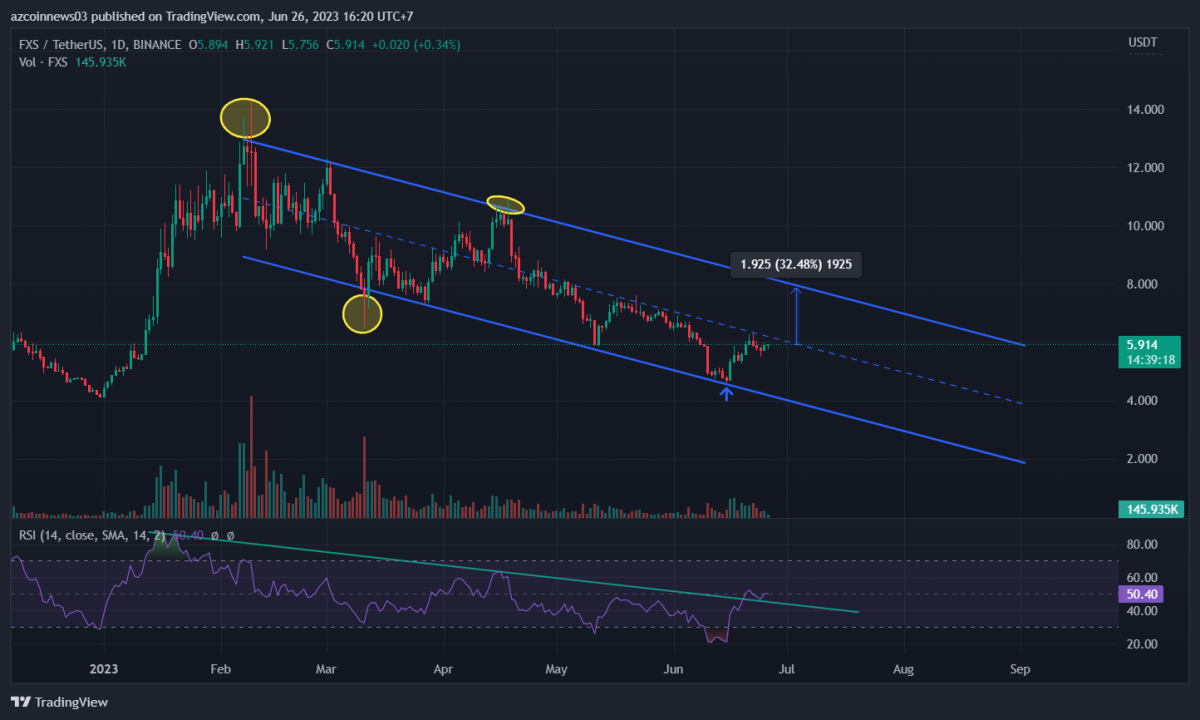 FXS daily chart / Source TradingView
The most likely outlook suggests that FXS price will continue to rise in the near future. Initial target is $6.7, with the upside potential moving towards $7.9.
AVAX shows signs of fatigue
According to CoinGecko, the price of AVAX, which is currently at $13.37, has increased by 2.7% in the last 24 hours. It was also accompanied by an impressive seven-day increase of 18.0%. However, on closer inspection, AVAX’s recent upward momentum may be losing momentum.
AVAX gained a significant 40% in value between 10-25 June. Thus, it created a price range between $9.65 and $14.25. Despite approaching the upper end of this range, signs of exhaustion are becoming more and more pronounced. Specifically, between June 21-25, the price of AVAX formed three distinct high peaks. However, AVAX’s Relative Strength Index (RSI) and Awesome Oscillator (AO) formed lower highs during the same period.
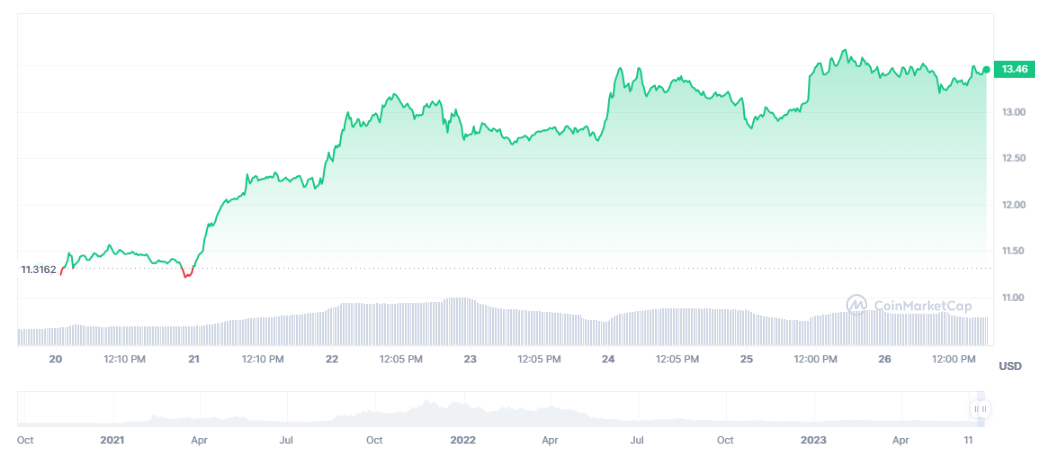 AVAX 7-day price climb / Source: CoinMarketCap
Known as the “downward divergence”, this mismatch shows that the momentum behind AVAX’s recent rise is waning. In technical analysis, this formation typically acts as a sell signal. It also often precedes a correction in the underlying asset.
Exploding UNI has more fuel in its tank!
cryptocoin.com As you follow, a recent UNI report highlighted that Uniswap’s incentives on the Omtimism Network (OP) have had different implications when it comes to the liquidity and decentralized finance (DeFi) sector. The effectiveness of these incentives is different. However, UNI’s price showed a strong uptrend on the charts.
In the last 24 hours, UNI has experienced a significant rise. Thus, its price reached $5.46 on CoinGecko, registering an impressive 15.3% increase. Additionally, over the past seven days, UNI has also shown remarkable growth. Accordingly, it rose by approximately 22%. These significant price increases point to a positive market sentiment surrounding UNI. It also shows the potential for more upside moves.
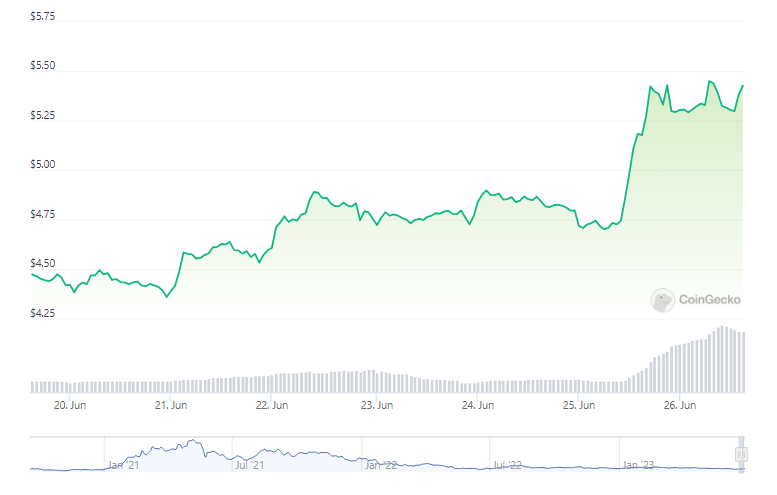 UNI price action in the last seven days / Source: Coinecko
Oc-chain data analysis showed a significant drop in Uniswap’s supply on exchanges in early June. It also revealed that this was followed by a sideways movement period from mid-June. These data show that selling pressure on UNI eased in the short term as the amount of UNI moved to centralized exchanges (CEX) for unloading decreased. This shift in UNI supply and trading behavior highlights the evolving dynamics in the Uniswap ecosystem. With reduced short-term selling pressure and increased long-term holding potential, UNI’s price stability and upside potential could be supported.