The Shiba Inu (SHIB) has broken out of a long-term resistance line and is showing signs of a completed correction, according to crypto analyst Valdrin Tahiri. For AAVE, the analyst says several on-chain metrics point to a prolonged price decline. The analyst is also evaluating and guiding AXS and LTC.
Is the Shiba Inu (SHIB) ready to take to new heights?
SHIB price broke out of a descending resistance line at the end of January. It then hit a year high of $0.0000154 before falling. The decline caused the line to confirm as support on May 7 (black icon). Although the price has bounced since then, the daily RSI is still below 50. Therefore, it is not clear that the trend is bullish.
If the increase continues, SHIB price could reach the $0.0000147 resistance area. However, if it breaks below the descending resistance line, it will confirm that the trend is bearish. In this case, the downside move might accelerate towards the next nearest support at $0.00000850.
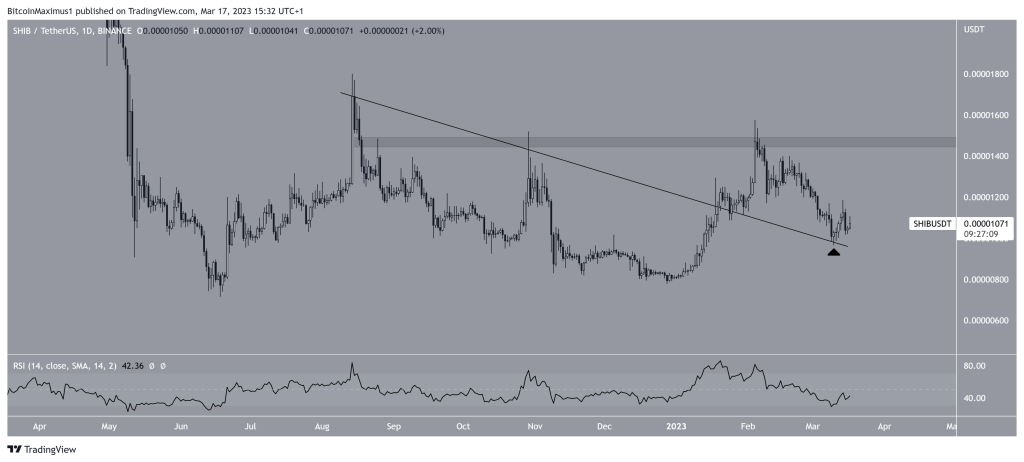 SHIB daily chart / Source: TradingView
As a result, it is possible for SHIB price to complete an ABC correction and increase towards at least $0.0000160. However, if it fails to break out of the descending resistance line, a drop to the $0.00000850 support area could follow.
Will AAVE price recover and reach new highs?
IntoTheBlock’s Global Money In/Exit data gives an idea of potential AAVE bullish price performance. The GIOM metric tracks the price distribution of token holders by the volume of tokens held at each address. Only 33% of AAVE holders are “lucrative” or “profitable” around current prices. Still, AAVE is currently signaling impending selling pressure.
Based on current on-chain indicators, AAVE is likely to drop to $68. This is where 16,000 addresses with 3 million tokens can offer some boost. If this support doesn’t hold, AAVE will likely drop to $55. Average purchase price of 2 million tokens and another cluster of 20,000 holders.
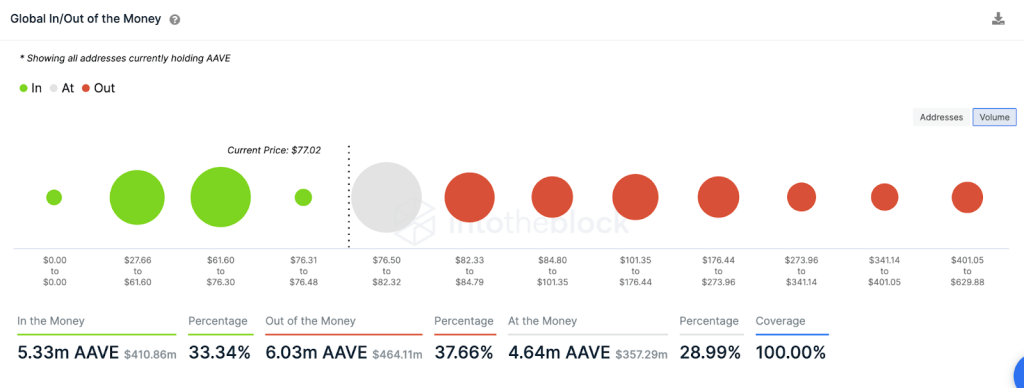 Source: IntoTheBlock
However, if AAVE makes an unexpected recovery, it can be tested at $85 initially. The maximum price of 13,000 addresses bought 6.4 million tokens. If it rises above $85, the AAVE could rally towards the next cluster of important resistances near $110. Here’s where 28,000 addresses might be looking to make some profit from their 2.3 million AAVE holdings.
AXS price prediction: When will the bear wave break?
IntoTheBlock’s Stock Market Depth chart provides a data-driven forecast of potential AXS price action in the coming weeks. Depth of Market or Bid-Ask spread is a segmented sum of limit orders placed by AXS holders on the largest exchanges. It shows important support and resistance points according to current prices.
The current downtrend will likely stop at $6.5 where a buy wall of 500,000 orders and a total buy wall of 137,000 AXS will offer strong support. If that doesn’t hold, there could be a drop towards $5 on the horizon.
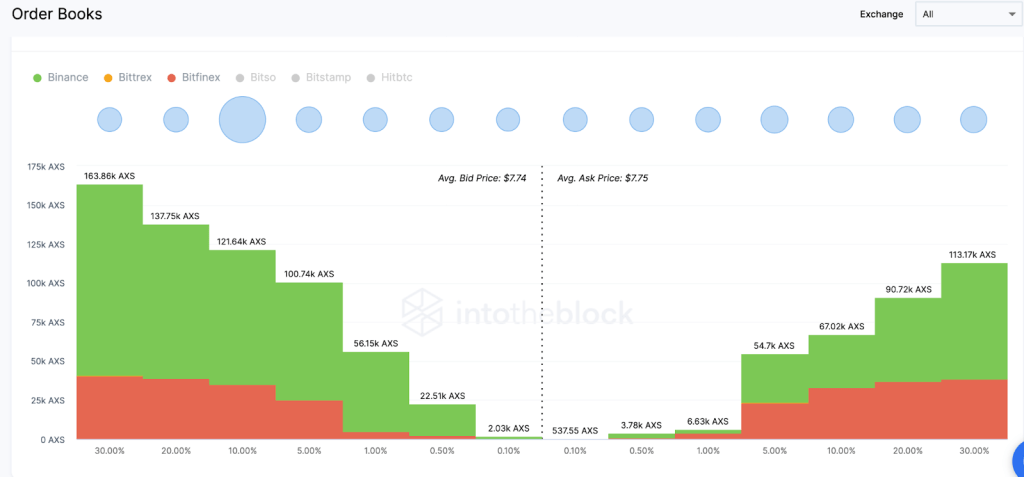 AXS Stock Market Depth, March 2023 / Source: IntoTheBlock
In contrast, if the trend turns bullish, $9.72 is a key resistance point as the exchanges’ total order books currently show 91,000 sell orders of around 1.5 million AXS tokens. However, if AXS scales this resistance point, 113,000 sell orders of 1.3 million AXS tokens at $12 will be the next cluster to be defeated.
Litecoin bulls still not ready to take control
Litecoin (LTC) price has dropped below a descending resistance line since it reached $413.49 in May 2021. This line started the current bearish move by rejecting the price (red icon) in February. Last week, LTC price confirmed this by bouncing around the $68 support area (green icon), forming a long lower wick (green icon). This is considered a sign of pressure to buy. Also, the weekly RSI has bounced at 50, another bullish sign.
If the price breaks out, the main resistance area will be $105. This is the last resistance before $270. Therefore, if the LTC price rises above this, it could greatly accelerate the rate of increase. However, if the resistance line rejects the price, another test of the $68 support area is possible.
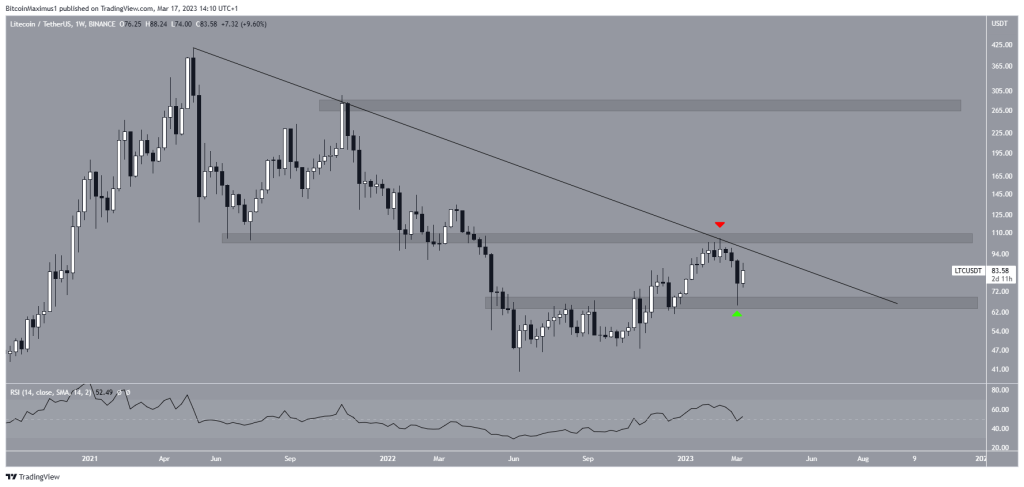 LTC weekly chart / Source: TradingView
As a result, whether LTC price retraces the support line of the previous wedge can determine the future trend. If it does, the price may break out of the long-term descending resistance line. If rejected, a drop towards $52 could follow.