SHIB, Ethereum and Ripple prices have returned to critical support levels in the past 24 hours as Bitcoin approached $27,000. What does technical analysis say about the next levels? Analyst Valdrin Tahiri’s views are as follows…
Is the Shiba Inu (SHIB) price rise over? Will he get support?
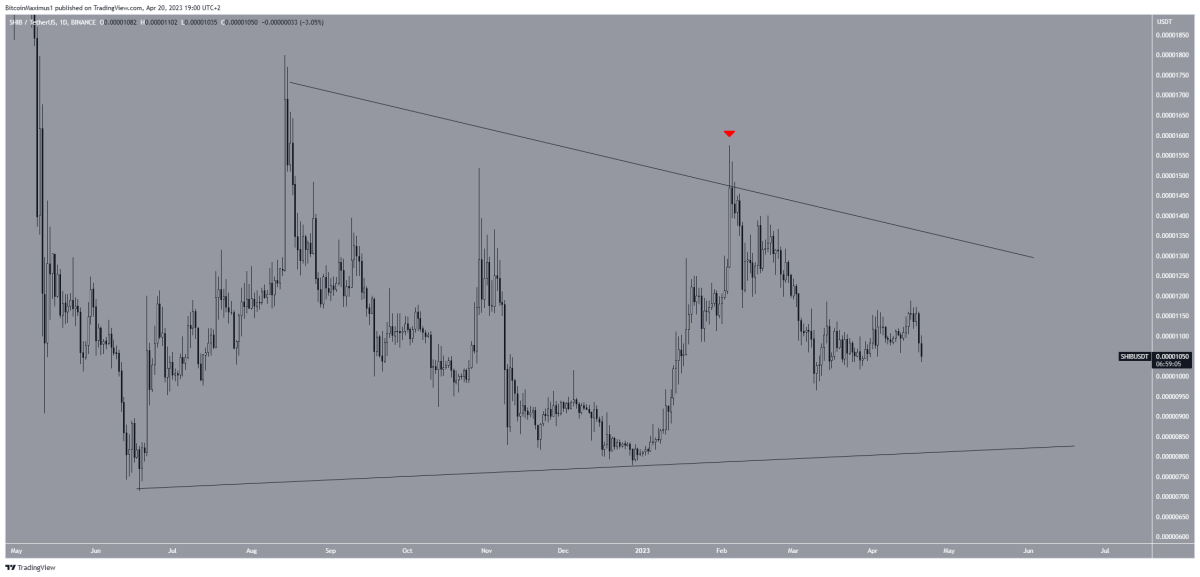
Shiba Inu price has been trading inside a symmetrical triangle since June 2022. This pattern presents a neutral outlook and indicates that both a breakout and a breakdown are possible.
Currently, the price is stuck in the middle of the triangle and is in a downward move after being rejected from the resistance line on Feb. As price moves inside the triangle, it could bounce off the support and resistance lines before a definitive move. If this is true, SHIB price could decline to the triangle support line at $0.0000085.
Could the SHIB price drop further?
A short-term six-hour technical analysis for Shiba Inu price offers a bearish forecast for two main reasons.
First, the price broke through an ascending parallel channel. The channel has been controlling the price action since March 12 and the breakout shows that the previous bullish structure is no longer present. A drop in price signals a possible downtrend. Also, the failure of the pattern to reach the resistance line (red icons) indicates that the trend is weakening.
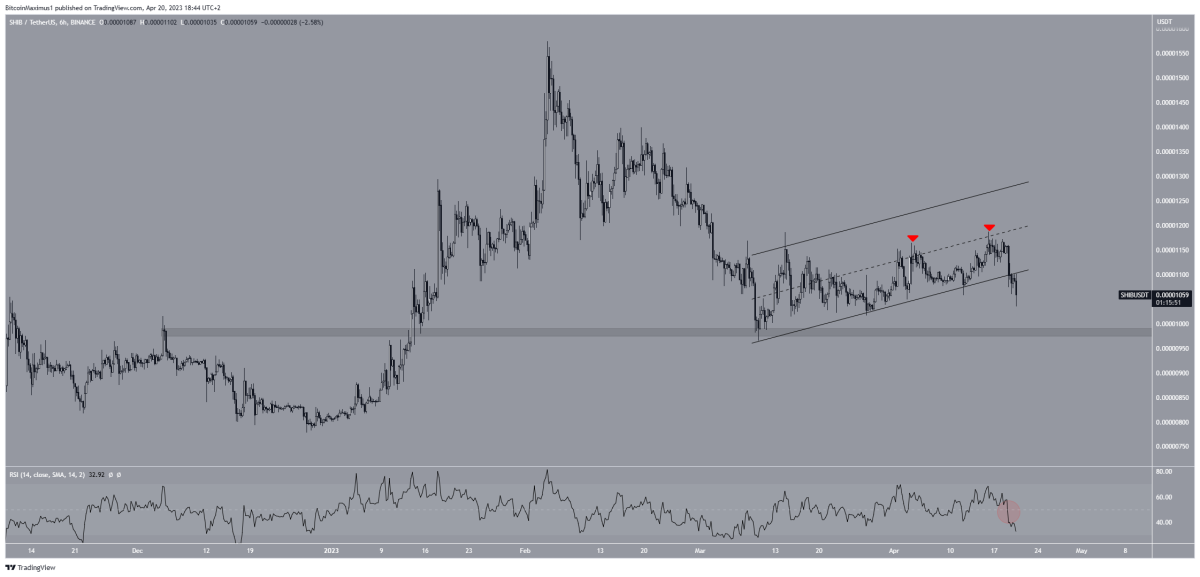
Second, the six-hour RSI is below 50 and falling. Readings above 50 and bullish indicate that the bulls still have an advantage, while readings below 50 show the opposite. The current bearish reading suggests a drop to the $0.0000098 support area is likely. If it breaks through this level, SHIB price could drop to the support line of the long-term triangle.
Ripple (XRP) price enters a rough period
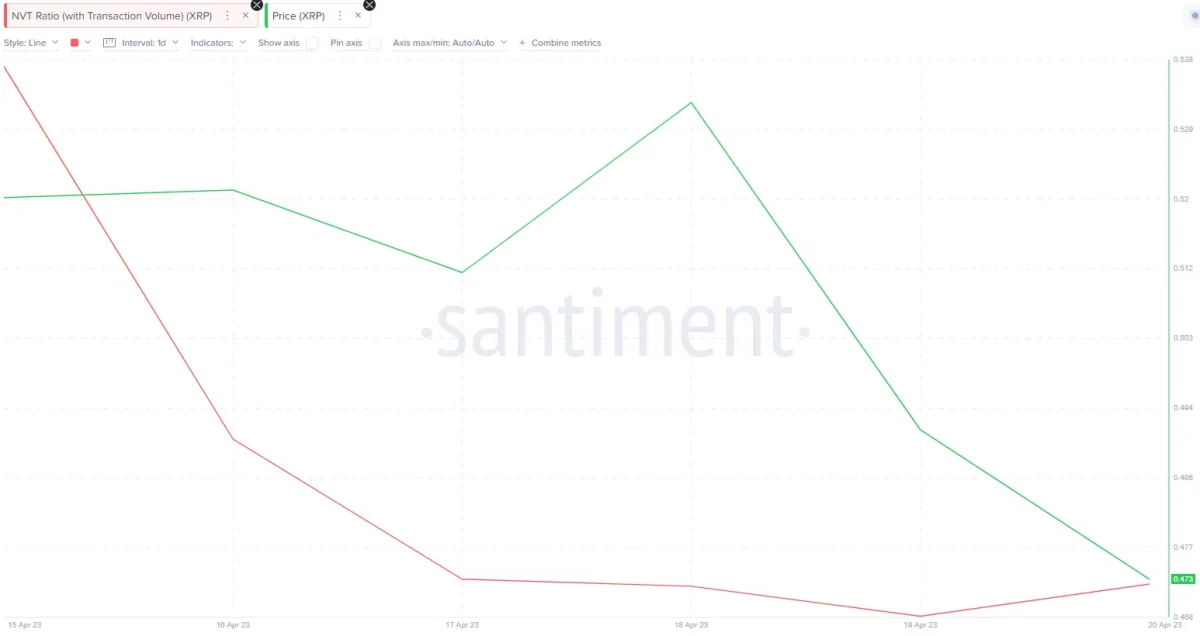
On the other hand, XRP’s bearish outlook emerged with the Network Value Transaction Volume Ratio (NVT) indicator hovering at lower levels. The NVT ratio compares a coin’s market cap to its trading volume to measure its fundamental value.
The red line on the chart shows that XRP’s NVT ratio has been on a downward trend in recent weeks. Between April 15 and April 21, the rate fell 80% from 355.87 to 79.85. This decline raises the possibility that XRP will appreciate below its current prices.
XRP whales continued to buy despite the drop
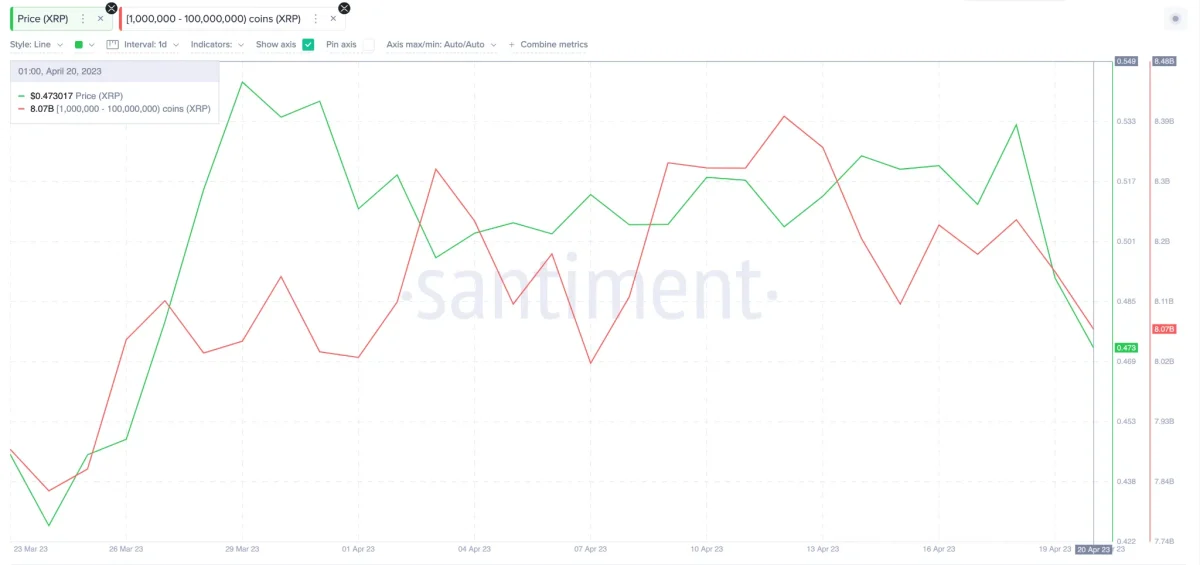
Crypto whales continue to hold amounts of XRP ranging from 100,000 to 100 million despite the recent altcoin market fluctuations. According to data from Santiment, this class of whales has a balance of over 8 billion XRP since the end of March.
Looking at the chart, the whales’ total balance now stands at 8.07 billion XRP, up 250 million from the 7.82 billion XRP recorded on March 24. The newly added 250 million XRP is worth around $120 million at the current market cap. If this optimism of the whales continues, XRP’s support of $0.45 will likely be retained.
How strong are XRP bulls to hold the $0.45 support level?
Last week, XRP bulls managed to defend the $0.45 support level. According to Santiment’s Market Value to Realized Value (MVRV) data, a rebound in prices may be imminent.
Currently, 6% of XRP holders who have purchased in the last 30 days are at a loss. Historical data shows that they will stop selling in this region to prevent further losses. If that happens, the price could rise 13% to $0.52 before Ripple investors start selling.
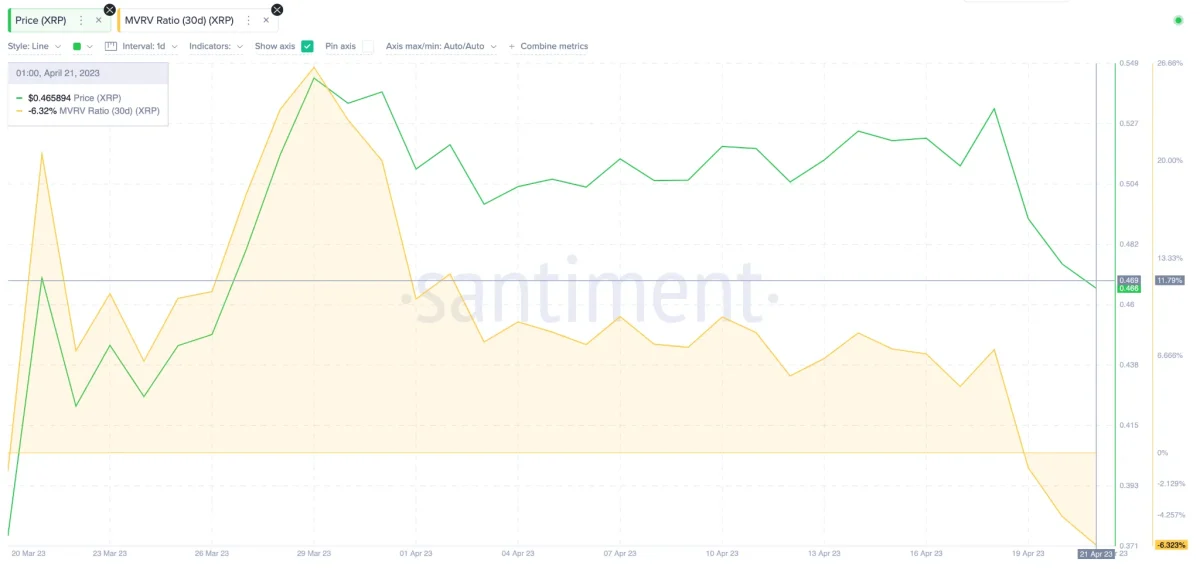
If XRP manages to break past this resistance level, the bulls could lead the rally towards the $0.60 region before book profits. Still, the bears could turn the tide if the XRP price drops below $0.45.
Technical analysis suggests a drop of 18% to $0.39 if the $0.45 support level is broken. But in this case, some investors may cut their losses and unintentionally trigger a rebound.
SHIB, XRP, and Ethereum will largely follow the news feed
The main feature that distinguishes Ethereum from other altcoins is its smart contract capability and the usage areas it brings. ETH price is affected by numerous factors that can lead to price fluctuations. Some of the key factors are:
- Market demand: Ether supply and demand in the market can significantly affect its price. Factors such as increased adoption, increased use cases, and increased interest from institutional investors can drive demand and therefore price.
- Legislative changes: Regulatory decisions and changes in government policies towards cryptocurrencies can affect the price of Ethereum. Positive regulations encourage adoption, while restrictive policies cause a decrease in demand.
- Technological advances: Improvements and upgrades to the network, such as the transition from Ethereum 1.0 to Ethereum 2.0, can affect price by affecting its scalability, security and efficiency.
- Macroeconomic events: Global economic events such as financial crises or political instability can affect investor sentiment and cause price fluctuations in the cryptocurrency market, including Ethereum.
Ethereum is not a security. pic.twitter.com/cEDOAfuv6G
— BORED (@BoredElonMusk) April 18, 2023
cryptocoin.com As you follow, the cryptocurrency market is currently in the focus of new regulations from the USA and Europe. In this article, we have included the latest debates about what they can be securities.