Terra Classic (LUNC) and Shiba Inu are showing optimistic signals over the weekend. Let’s take a look at the technical levels that select cryptos SHIB, LUNC and HBAR can test in the week with Bitcoin approaching $25,000.
Shiba Inu may be gearing up for price hike
The Shiba Inu price is going through the consolidation phase after experiencing a 3% increase on February 17. The recent price action is encouraging traders to join the market as the price is able to break past the 8-day and 21-day EMAs. The Shiba Inu is currently trading at $0.00001325. RSI data also reinforces the bullish concept. Support levels rising from 0.00001200 to the current price level draw a horizontal line on the RSI near the mid-way point, indicating that the underlying bullish strength is absorbing the sell-off.
Given these factors, it could retest the February peak of 0.0001573, according to technical analyst Tony Montpeirous. This could result in a potential 19% increase from the current market cap of $0.00001324.
On the other hand, a break below the recent low of $0.00001323 would invalidate the bullish argument. In this scenario, SHIB price could decline to support levels around $0.00001200, a 9% decrease from SHIB’s current market cap. Similarly, in Terra Classic it trades in a setup where it can make drastic moves in two directions.
Terra Classic price shows a dual scenario
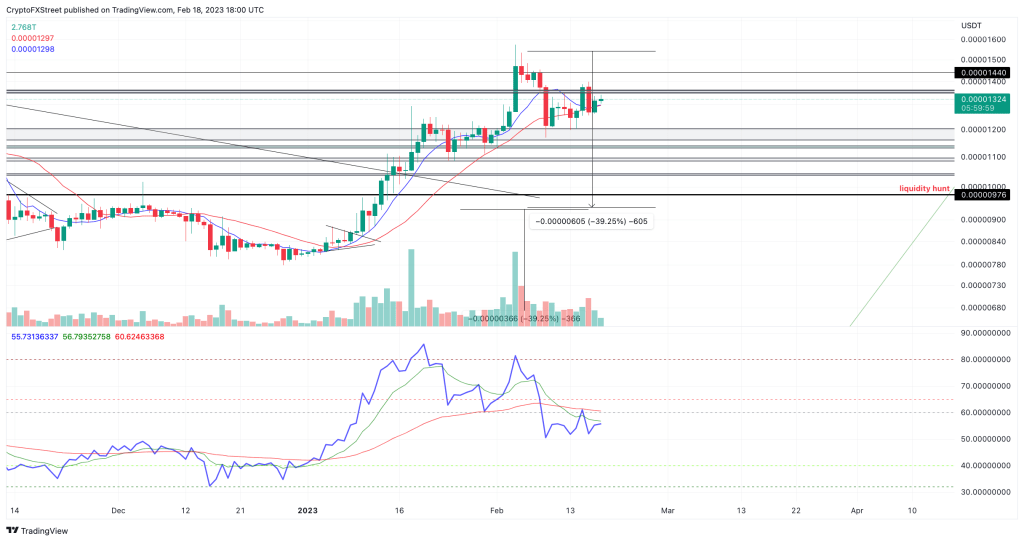
Terra Classic has been trapped in its $0.00017000 zone for about a week. At the time of writing, back-and-forth price action occurs between the 8-day exponential and 21-day simple MAs. While convergent market behavior often results in a volatile move, it may take a few more days for a spike in LUNC volatility to occur. Therefore, it is important for traders to make automatic entries in the direction of trading trends to catch the next trend move.
According to technical analysis, a break above the weekly high of $0.00017080 will likely result in a retest of the $0.00020000 liquidity level. The bullish scenario points to a 15% increase from the current price of Luna. The invalidation of the bullish thesis could result from a breach of the 8-day SMA below $0.00016420.
However, a daily candlestick near the 8-day EMA will likely catalyze a 15% move to the downside targeting the $0.00014550 region. An invalidation of the bearish scenario could result from a break above the 21-day SMA at $0.00017060.
HBAR price still at risk despite rising
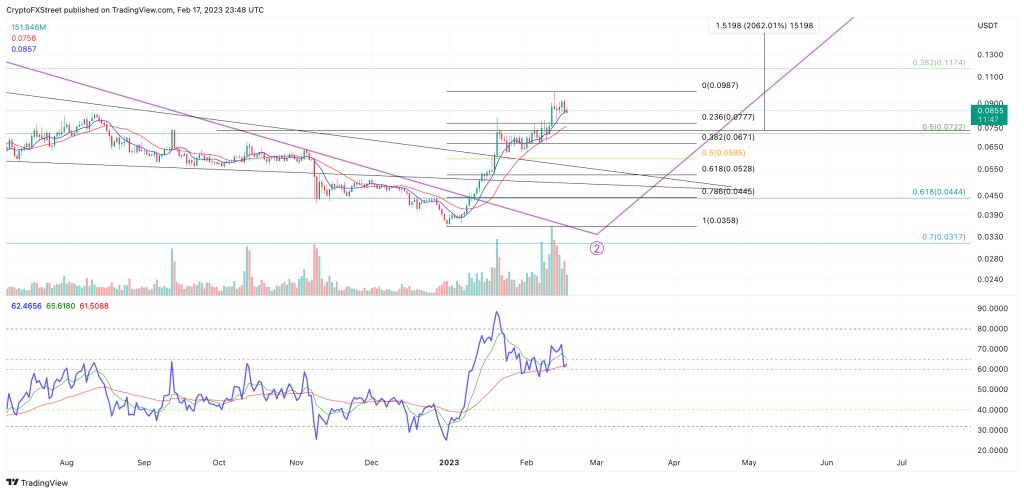
Hedera Hashgraph price is up 4% on the day when support was tested once again near the 8-day EMA. Despite the uptrend, the RSI consolidates the need for caution as it had several bearish divergences during the winter rally. Additionally, the newly marked $0.091 swing point is showing an M pattern on the RSI. According to classical technical analysis, the M pattern on the RSI is an instant sell signal.
Given these factors, it is quite possible that a pullback will occur within the current uptrend. A Fibonacci retracement instrument surrounding the winter rally is showing a strong confluence zone between the $0.052 and $0.59 area. A drop towards these levels will result in a maximum reduction of 40% from the current market value of HBAR.

If the RSI is correct, then HBAR price cannot produce a candlestick above the $0.098 high of YTD. If the bulls produce a daily candlestick above the resistance, the uptrend will likely continue to push liquidity levels up to 0.12 cents in the short term. If the bulls are successful, Hedera Hashgraph price could rally 40% according to analysis. cryptocoin.comAs you can follow, the market is currently in a strong position where it can pave the way for this rally.