Bitcoin price is seeing a major consolidation above the 200-week SMA at $22,794. Meanwhile, the Shiba Inu price is showing a grueling consolidation at $0.00000118. Here are the latest predictions for two popular cryptocurrencies…
Is there a 150 percent chance of a rise for the Shiba Inu?
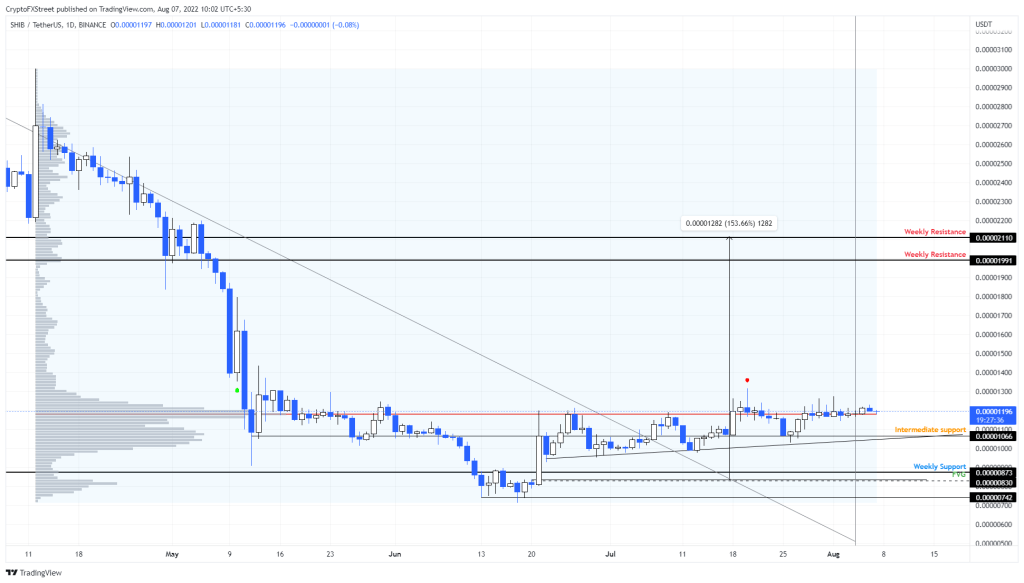
Analyst Akash Girimath first shared his predictions for one of the most popular meme coins, SHIB. The Shiba Inu price has been hovering around a major hurdle for about three months with almost no momentum to act on it. According to the analyst, this development may be ready for a strong move. However, the direction trend is unknown. Shiba Inu price has been consolidating around the control volume point (POC) at $0.0000118 for about three months. This barrier is the highest level traded since April 12, 2022.

Therefore, it is expected to act as a support or resistance level depending on where the price is trading. Shiba Inu price is up 68 percent in three days after bottoming out at $0.0000071 on June 18. The upward move left a large gap, known as the fair value gap (FVG), stretching from $0.0000083 to $0.0000092. These gaps are usually filled when the grand rally returns to the average. For SHIB, this has yet to happen and therefore presents a bullish opportunity for investors.

According to the analyst, traders can expect the Shiba Inu price to fill the FVG and open a long position there. On the positive side, $0.0000199 and $0.0000211 can be seen after POC consolidation. In total, this move will constitute a 150 percent rise. However, if SHIB produces a daily candlestick below $0.0000074, it will create a lower bottom and present more collapse risk.
What’s next for Bitcoin?
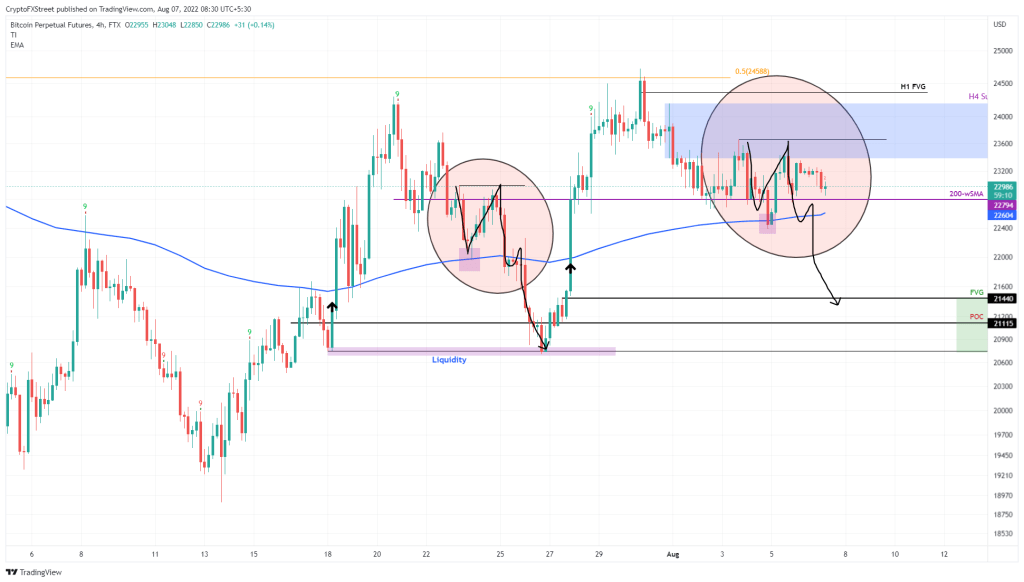
Despite the announcement of BlackRock’s entry into crypto, the Bitcoin price is performing sluggishly. Due to the interest on Ethereum and the upcoming Merge update, investors seem to be neglecting BTC. However, the bears may be taking control because of this fractal formation, which predicts a steep correction. At least that’s what analyst Akash Girimath’s comments are about. The Bitcoin price fractal in the aforementioned formation revolves around the 30-day Exponential Moving Average (EMA). When BTC last broke above the EMA, it rallied roughly 13 percent. It has set a local top at $24,296.

The rollback of this move took place over the next five days. A double top was formed at $22,999. This price action took place for eight days and the gains were completely retracted. The fractal seems to be repeating once again. This time, however, BTC has set the 30-day EMA at $24,565 as a local high. The only action left to complete the fractal is the double top formation at $23,666. Once this double top occurs, the probability of an eventual drop will increase. On the other hand, if bitcoin price breaks the $23,666 resistance level, it will invalidate the fractal. However, the decline will be invalidated if BTC produces a daily candlestick above $24,565.


