The failure of Bitcoin BTC bulls to step in has increased the chances of retesting the $29,500 support. The fact that Bitcoin is stuck in a narrow range makes it difficult to predict the direction of the next possible breakout. The US Dollar Index (DXY), which often moves in inverse correlation with Bitcoin, has dropped below 100. However, this failed to push Bitcoin higher. This shows that Bitcoin has drawn its own course in the near term.
What will affect BTC and the markets this week?
Therefore, this week’s earnings season for major companies could affect stock markets in the United States. But it may not have the same effect on BTC. It is becoming increasingly difficult to pinpoint the event or news feed that will cause the price of Bitcoin to break out of this range.
Uncertainty about Bitcoin’s next directional move to BTC has not deterred the whales. CryptoQuant contributing analyst, SignalQuant, highlighted that an on-chain indicator, unspent transaction output is rising in 2023, similar to the increase seen in 2019. If the indicator continues to rise, it will signal that Bitcoin has room to run BTC. It will also indicate that the low made in late 2022 is a long-term low.
Can DXY show a recovery? Will this limit the rise in Bitcoin BTC and major altcoins? Let’s analyze the charts to find out.
S&P 500 Index price analysis
The S&P 500 Index (SPX) is in a strong uptrend. The price reached the 4.513 resistance, which could act as a minor hurdle. However, if the bulls do not give up too much from the current levels, it will show that traders expect the rally to continue.
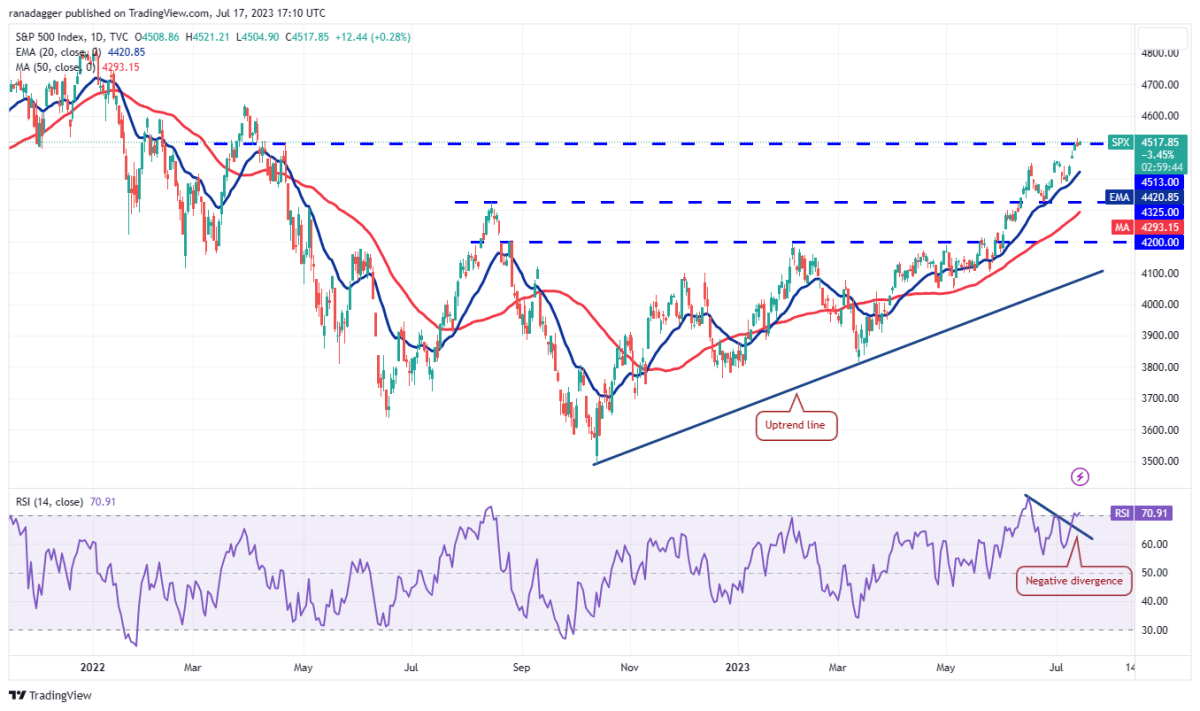
The negative divergence in the relative strength index (RSI) has disappeared. Accordingly, this shows that the bulls remain in control. If buyers push the price above 4.513 and sustain it, the index will resume its uptrend. There is also a possibility of reaching 4,650. This level can act as a strong barrier again.
On the way down, 4.420, the 20-day exponential moving average (EMA), is the important support level to watch out for. If this support is broken, it will signal that the bulls may be booking their profits. This could bring the price down to the 50-day simple moving average (SMA) of 4,293.
US Dollar Index price analysis
US Dollar Index fell below the moving averages on July 7th. It also continued its downward spiral. The bears completed the descending triangle pattern on July 12, pushing the price below the vital support at 100.82.
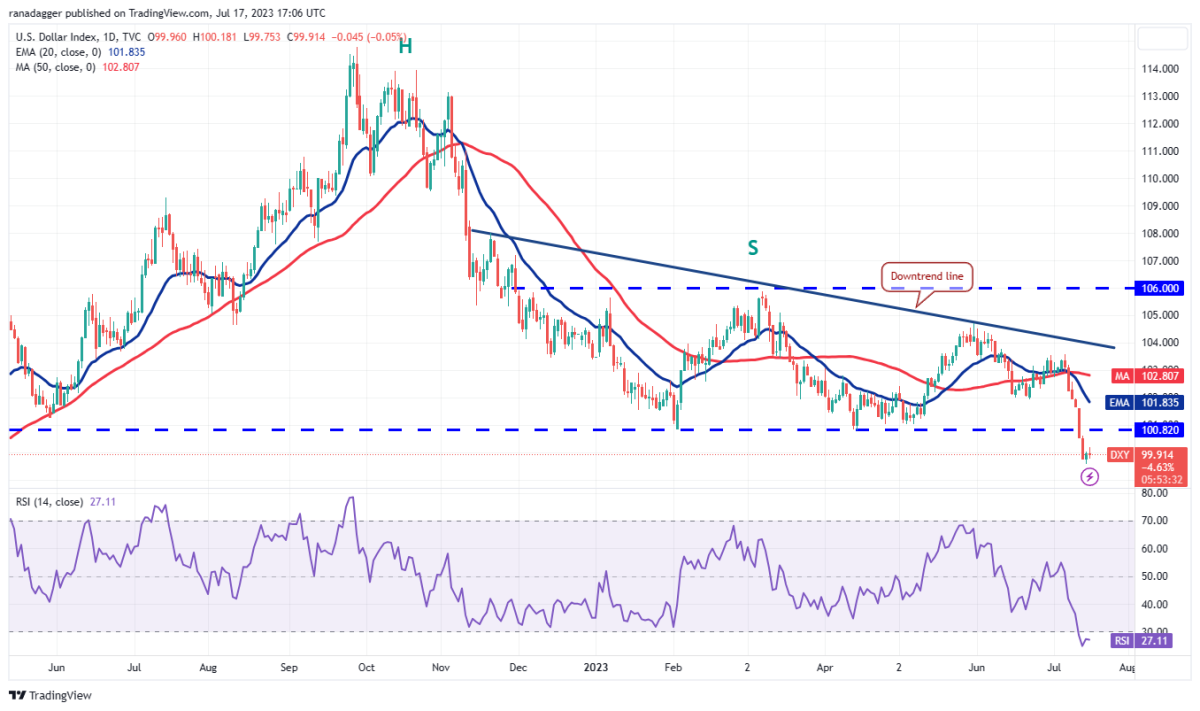
The sharp decline over the past few days has sent the RSI into the oversold territory. This suggests that a small recovery is possible. If the price turns up from the current level, the index will retest the breakout level of 100.82.
This remains the key level to watch. If the price turns down from this level, it will show that the bears have turned the previous support into resistance. This will start a downtrend that can reach 97. It may also collapse towards the pattern target of 93.64 afterwards. If the bulls want to avoid the decline, they must quickly push the price above 100.82 and protect it.
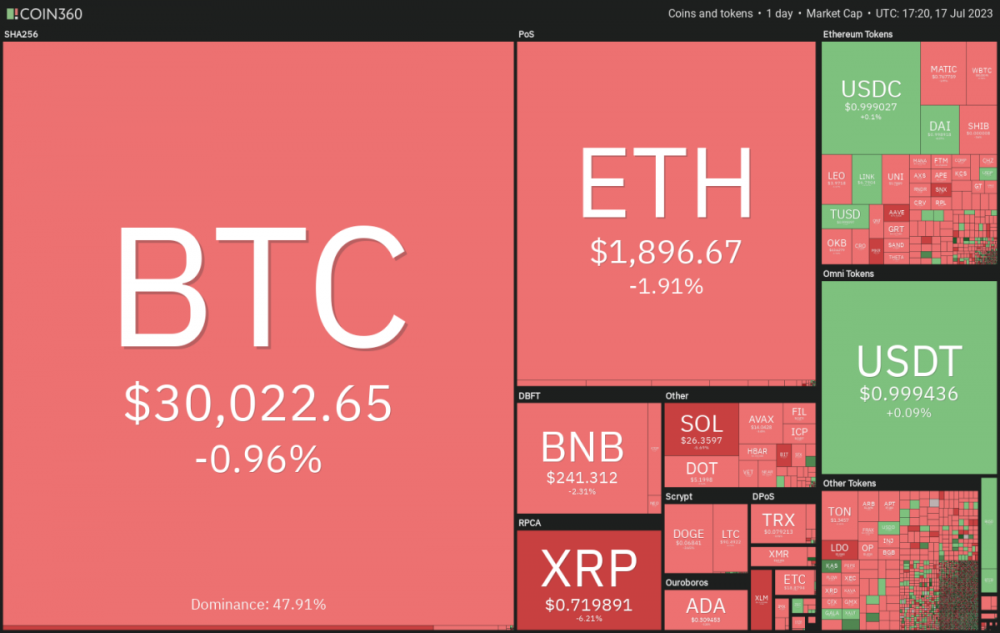
Bitcoin BTC price analysis
Bitcoin bulls have been defending the 20-day EMA ($30,173) for the past three days. However, they failed to initiate a strong bounce from this level as a negative sign. This indicates an aggressive lack of demand at current levels.
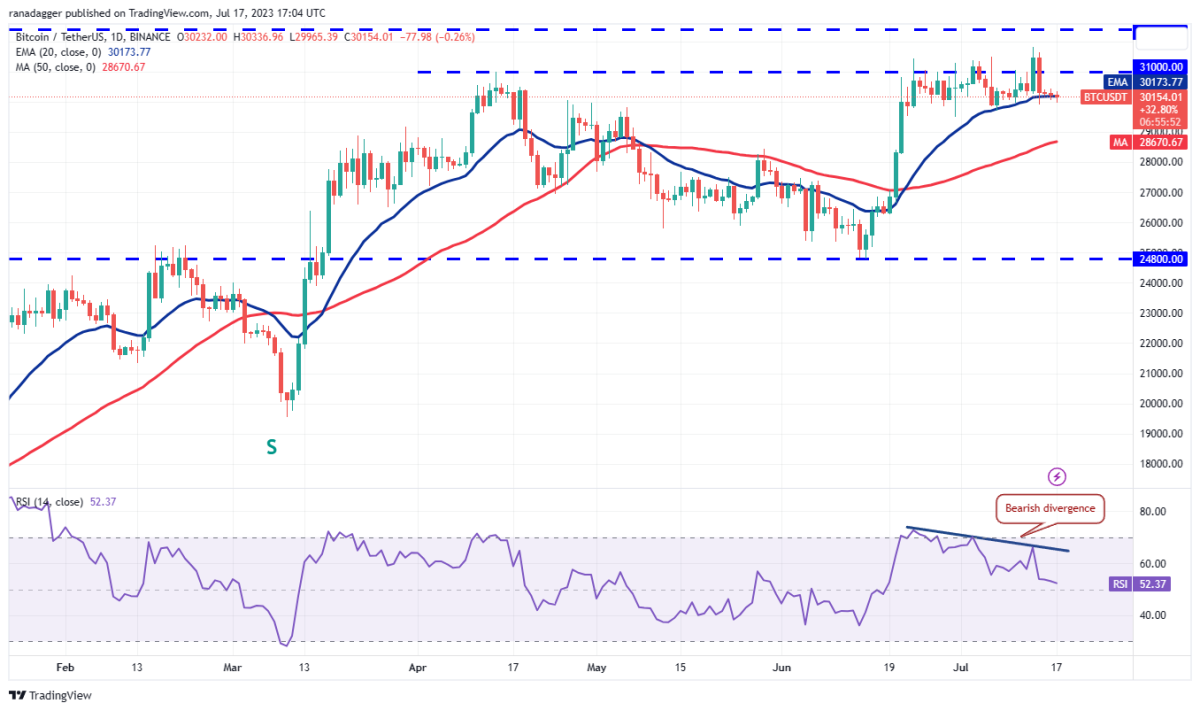
The 20-day EMA has started to flatten. The RSI is just above the midpoint. This shows that there is a balance between supply and demand. This could keep the pair in a tight range of $29,500 and $31,500 for a while.
Buyers will need to push the price above $32,400 to signal the start of the next leg of the uptrend. The BTC/USDT pair will later rise towards $40,000. Instead, the pair will slide to the 50-day SMA ($28,671) if the price dips below $29,500.
Ethereum price analysis
Ethereum’s attempt to stay above the 20-day EMA ($1,897) shows that lower levels are attracting buyers.
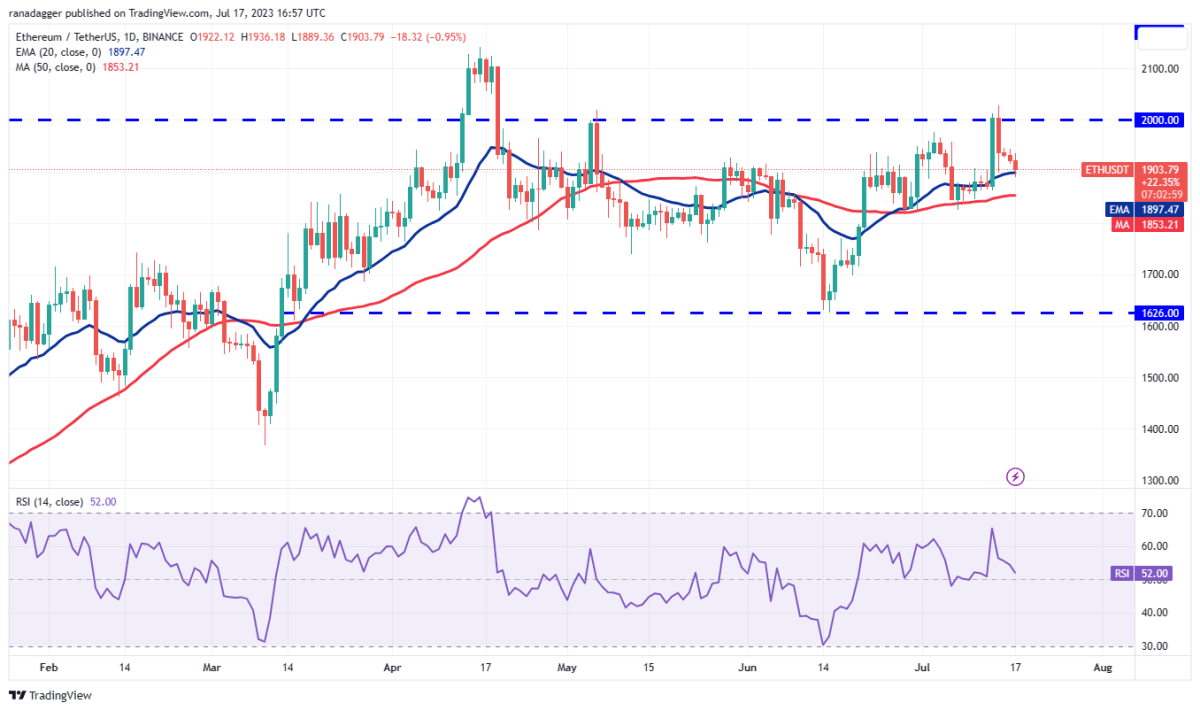
The bulls will try to push the price towards the psychological resistance of $2,000. This remains the key level to consider. Because a break and close above this will clear the way for a possible rally to the $2,141 to $2,200 region. The most important support to watch on the downside is the 50-day SMA ($1,853). If this level is broken, it will show that the ETH/USDT pair could stay in the wide range between $1,626 and $2,000 for a while.
XRP price analysis
XRP is finding support in the region between $0.69, the 50% retracement level of Fibonacci, and $0.64, the 61.8% retracement level.
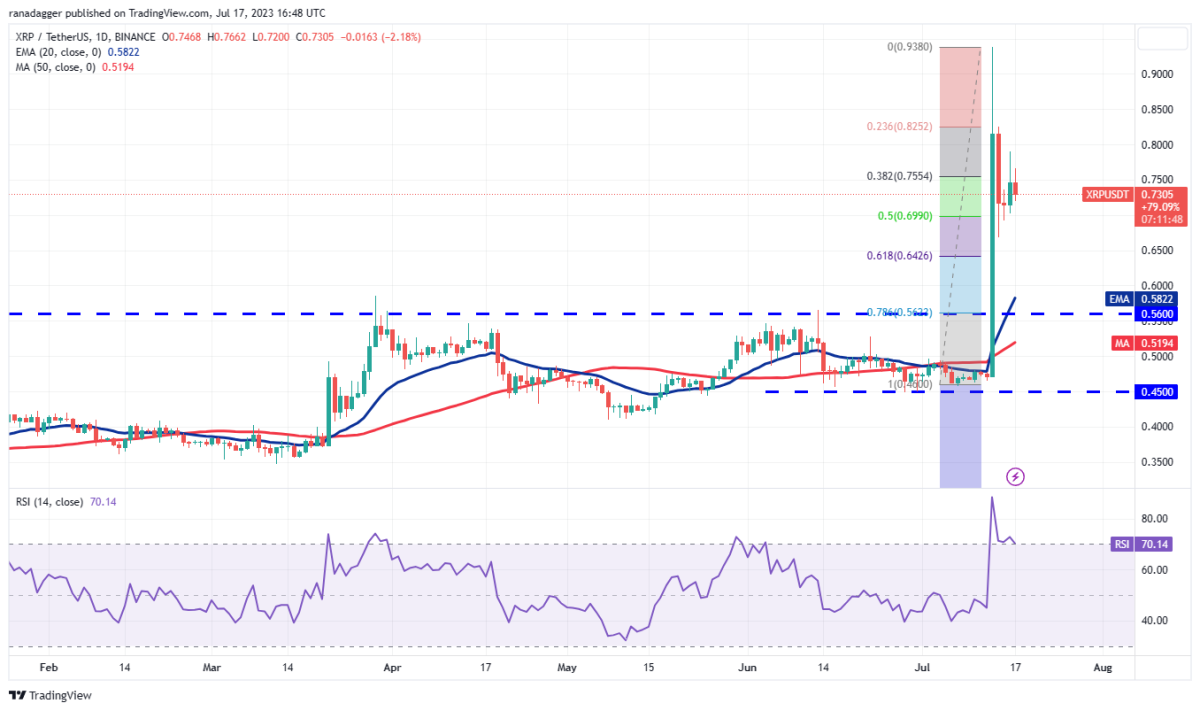
The bulls will try to continue the upward movement. However, they will face a tough resistance at $0.83 and again at $0.93. If the price turns down from this zone, the XRP/USDT pair could be stuck in a range for a few days. Another possibility is for the price to bounce back from the current level and slide below $0.64. If this happens, it will be a signal of urgency among the bulls to exit their positions. This will bring the pair down to the 20-day EMA ($0.58).
BNB price analysis
BNB has turned down from the 50-day SMA ($253). It re-entered the symmetrical triangle formation on July 14. This suggests that the bears are fiercely defending the overhead resistance of $265.
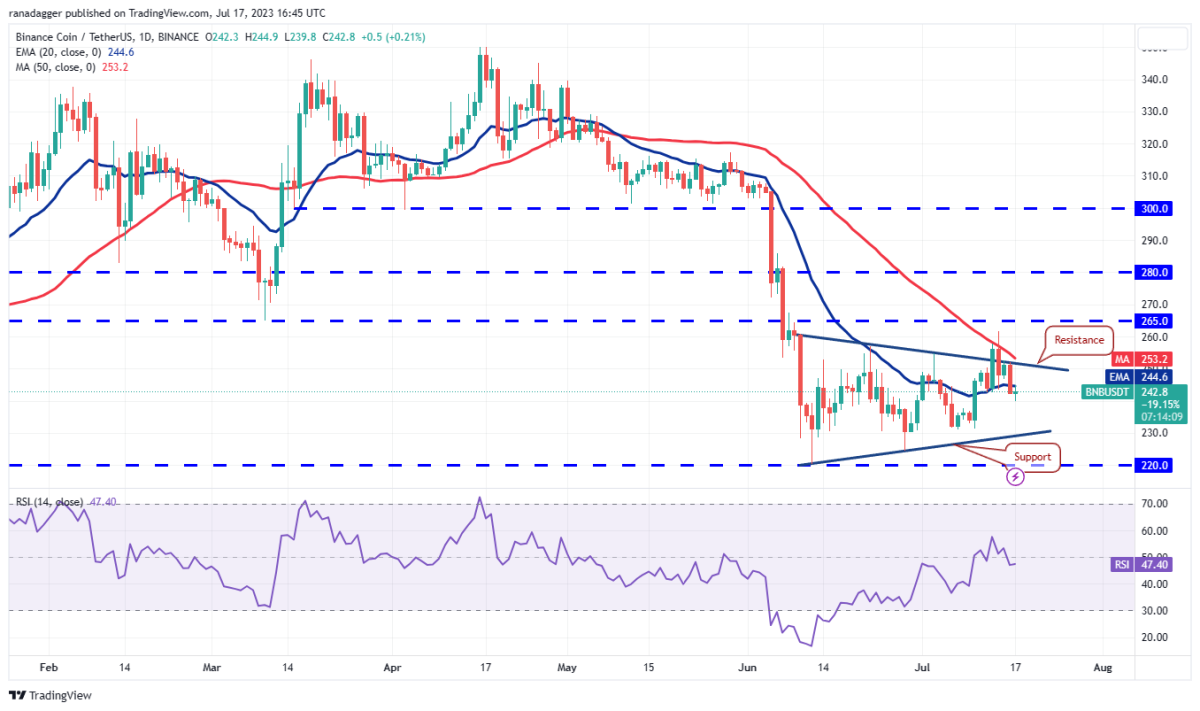
The 20-day EMA ($244) has flattened. The RSI is just below the midpoint. This shows that there is a balance between supply and demand. The BNB/USDT pair may oscillate within the triangle for a few more days. Buyers will need to push and sustain the price above the triangle to gain the upper hand. Momentum could increase after the bulls push the price above the $265 overhead resistance. Alternatively, a break below the triangle will signal the bears are back in the driver’s seat. The pair could continue its downtrend below $220.
Solana price analysis
Solana forming an intraday candlestick pattern on July 15 and 16 indicates short-term uncertainty about the next directional move.
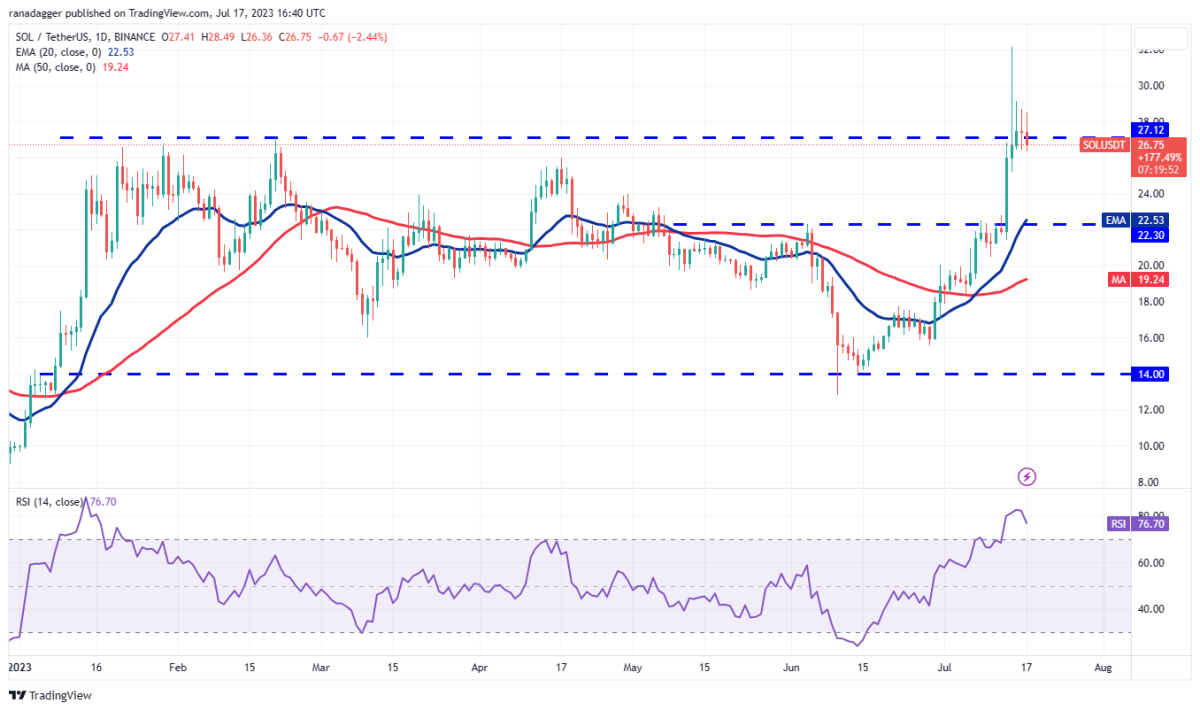
Generally, a narrowing in the range is followed by a sharp breakout. If buyers push the price above $29.12, the SOL/USDT pair will jump to $32.13. A rally above this level will open the doors for more upsides to $38. Conversely, if the price drops and dips below $26, it will show that the advantage is tilted in favor of the bears. The pair will decline to $24 and then to the 20-day EMA ($22.53).
Cardano price analysis
Cardano’s retracement reached near the $0.30 breakout level. Usually such a deep correction delays the start of the next leg of the upward movement.
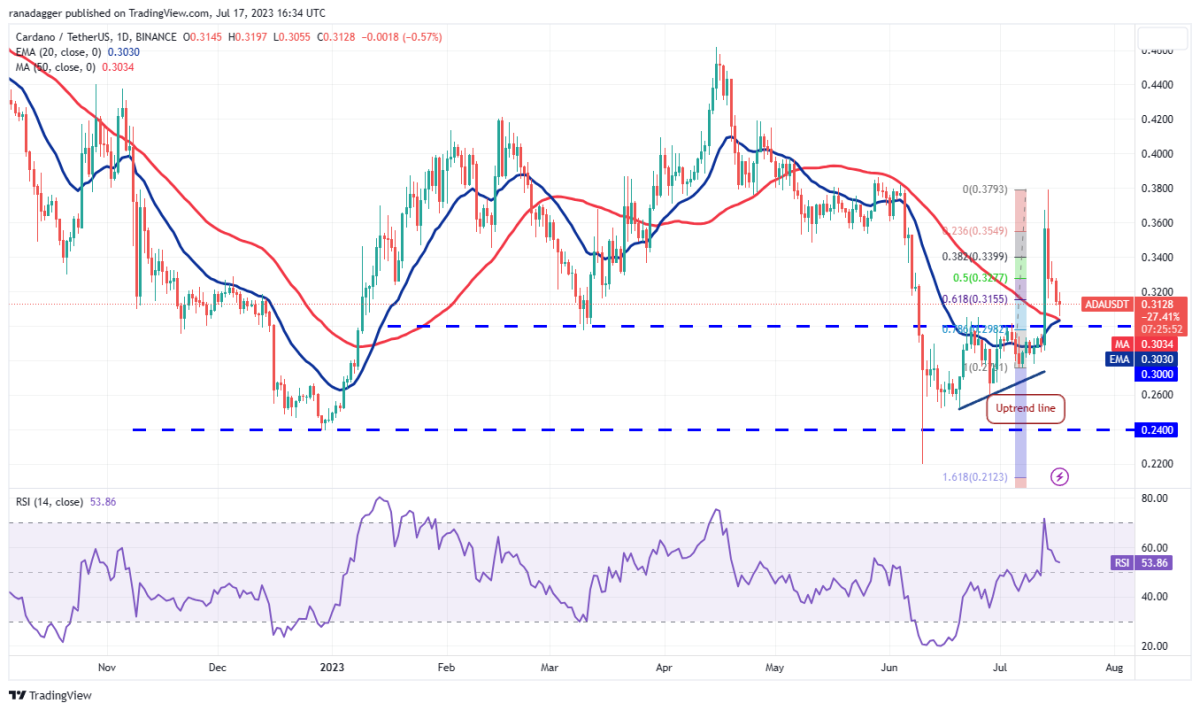
However, the moving averages are about to complete the bullish crossover. Also, the RSI is in the positive territory. This shows that the bulls have a slight advantage. On the other hand, if the price turns up from the current level, buyers will again try to push the ADA/USDT pair to the overhead resistance of $0.38. It is unlikely to be an easy road for the bulls. The bears will try to stop the recovery at $0.34 and again at $0.36. On the downside, a break and close below $0.30 will turn the advantage in favor of the bears.
Dogecoin price analysis
Dogecoin is witnessing a tough battle between the bulls and bears near the overhead resistance of $0.07.
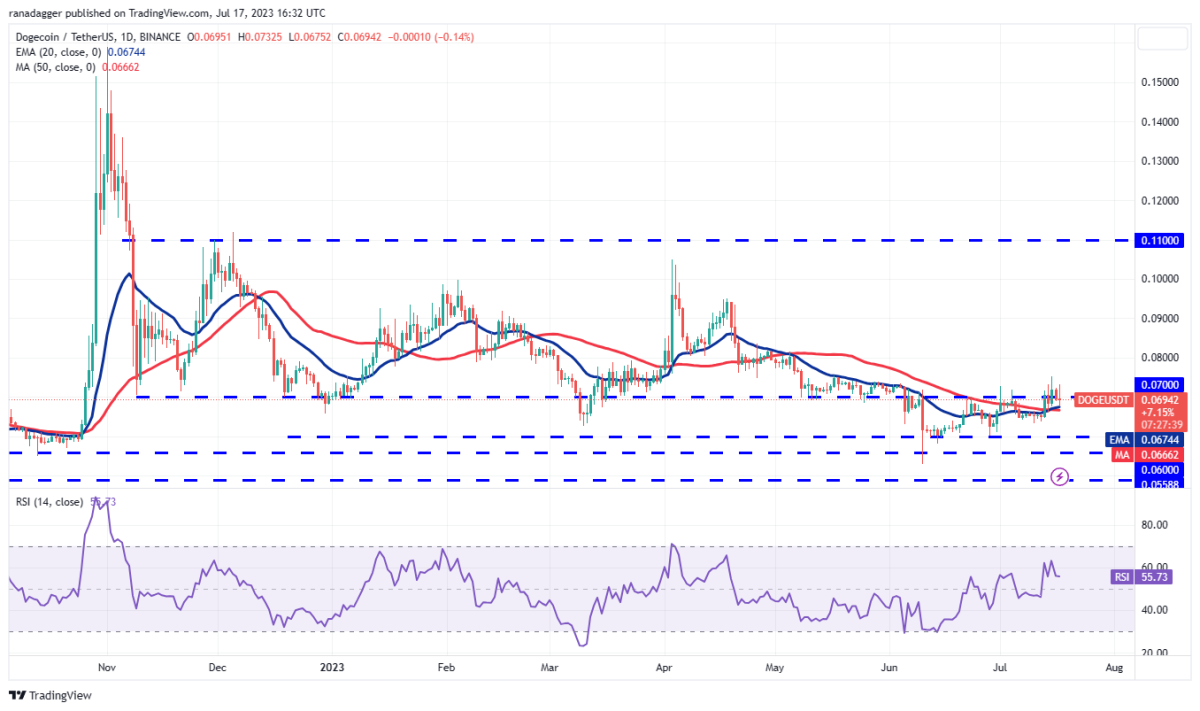
The 20-day EMA ($0.07) has started to rise. Also, the RSI is in the positive territory. This shows that the bulls have a slight advantage. Also, the bulls will try to push the price up to $0.08, where the bears can again make a strong defense. Contrary to this assumption, on the other hand, if the price drops and falls below the moving averages, it will indicate that the bears are continuing to sell in the rallies. This will keep the DOGE/USDT rate in the range of $0.06 to $0.07 for a while.
Polygon price analysis
Usually, price turns down and retests a breakout from a pattern. Polygon MATIC does just that. The price could drop as low as $0.72.
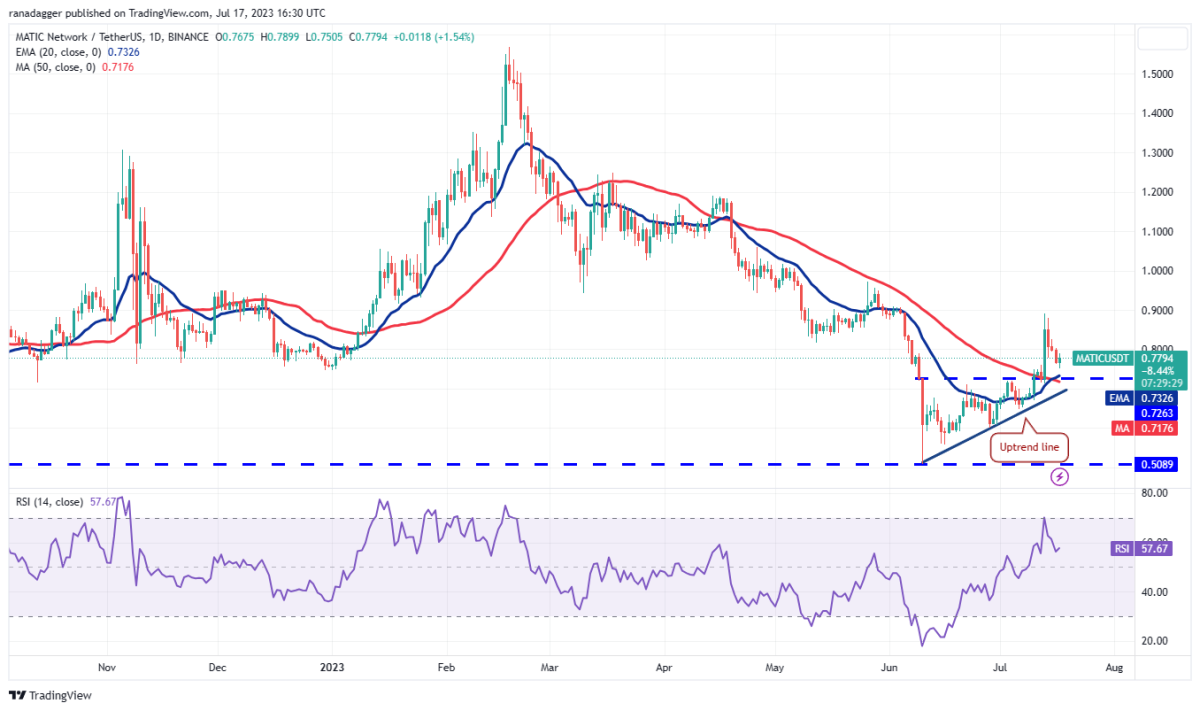
If the price recovers strongly from $0.72, it will suggest buying lower. Accordingly, the bulls will then try to push the price above the overhead resistance of $0.90. If they do, the MATIC/USDT pair will start the next leg of the upward move. On the other hand, the first stop will be $1 followed by $1.20 psychological resistance. This positive view will be invalidated if the price continues to decline and falls below the uptrend line. cryptocoin.comIn this case, the pair will fall to $0.60 later.