Gold prices rose in an environment where Israel-Hamas tensions escalated, highlighting the safe haven status of gold. However, a strong US employment report acts as a counterweight, limiting gold’s upside. Analysts are trying to determine the next course of gold.
With the increase in geopolitical risks, the tendency towards safe haven gold increased
cryptokoin.com As you follow from , gold witnessed a dramatic intraday reversal on Friday. It first dropped to the $1,810 region after the US monthly employment data. However, it later rose over 1.3% from its lowest level since March 8. Meanwhile, the US Nonfarm Payrolls (NFP) report confirmed bets that the Fed will make at least one more interest rate increase in 2023. Therefore, this put pressure on the precious metal.
However, additional details from the report revealed that wage growth remained moderate throughout the reported month, easing inflationary concerns that could force the Fed to soften its hawkish stance. This dragged the US Dollar (USD) down for the third day in a row. Thus, gold ended its nine-day losing streak. In addition, escalating geopolitical tensions in the Middle East supported gold’s rise. In this regard, the yellow metal reached its highest level in a week on the first day of the new week. However, the emergence of new USD purchases prevents the gold price from gaining further value. Investors can now look forward to the upcoming announcements this week. FOMC meeting minutes I and US consumer inflation figures I’m waiting for .

Gold price technical analysis: The path of least resistance is to the south!
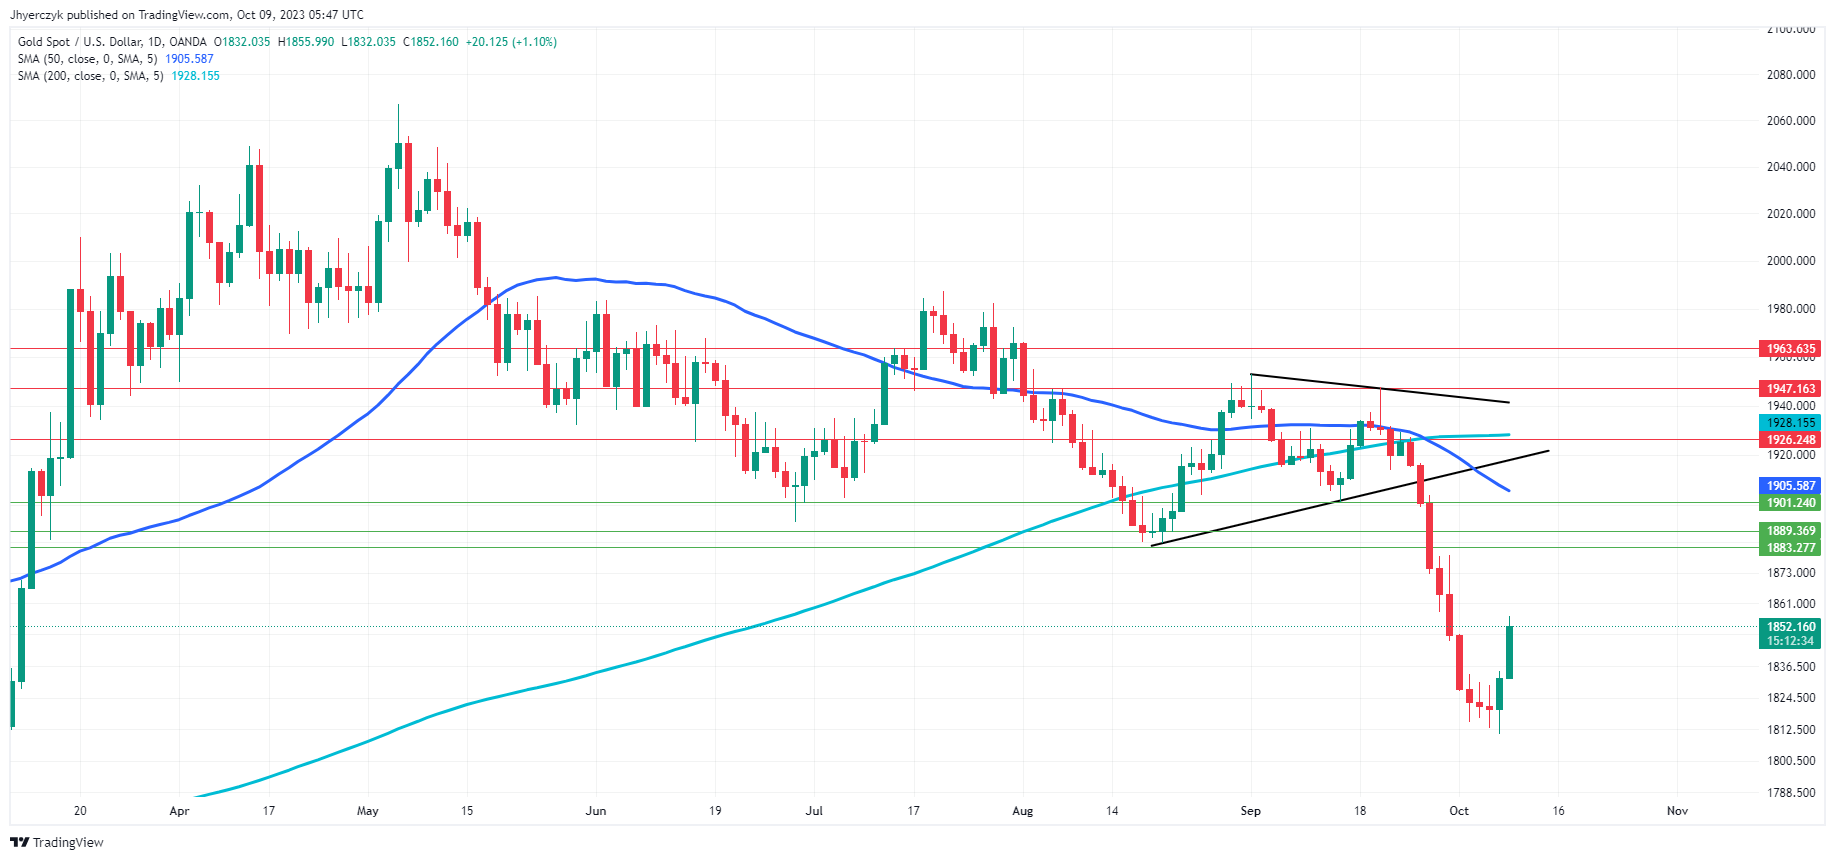
market analyst Haresh Menghani, evaluates the technical outlook of gold. The strong rally witnessed in the last two trading sessions can still be categorized as a technical bounce due to the oversold Relative Strength Index (RSI) on the daily chart. This However, a ‘death cross’ occurred as the 50-day Simple Moving Average (SMA) fell below the crucial 200-day SMA for the first time since July 2022. This shows that the path of least resistance for gold is still downwards. Therefore, any subsequent upward move is still viewed as a selling opportunity. It also runs the risk of deflating quite quickly.
From current levels, momentum beyond the daily top near $1,855-$1,856 is likely to face stiff resistance near the $1,865 region. However, some follow-on buying has the potential to push the gold price further towards the next relevant hurdle near $1,885. This is closely followed by the round figure of $1,900. This level should now act as an important turning point for short-term traders. On the other hand, the $1,835-$1,834 zone is currently maintaining downside. Below this, it is possible for gold to slide towards multi-month lows around $1,810.

More gains on the cards for shiny metal
CME Group’s latest data on gold futures markets showed open interest increased for the third consecutive session on Friday, this time by more than 1,000 contracts. Volume likewise increased by approximately 64 thousand contracts after two consecutive days of decline.

The significant recovery in gold prices on Friday is accompanied by increased open interest and volume. This leaves the door open for further upside in the very near term, according to market analyst Pablo Piovano. However, the precious metal has now retargeted the $1,900 region.
Gold price short-term forecast: Risks of decline are higher
market analyst James Hyerczyk, Analyzes the short-term outlook for gold. Given the tug-of-war between geopolitical risks and sound economic metrics, gold remains tight. The long-term outlook remains cautiously optimistic. Despite headwinds from the strong US economy, geopolitical tensions create enough uncertainty to create a base for gold. On the one hand, there is the impact of escalating conflicts in the Middle East. On the one hand, there are strong US economic data. Investors falling between these should be prepared for moderate volatility in the gold market in the near term.
 Gold price daily chart
Gold is currently traded at 1,851.94. Therefore, it is below both the 200-Day and 50-Day moving averages. This indicates a downward trend. The price is also below the minor and major support levels. This indicates a weak position. Despite a recent rally from the previous daily price of 1832.04, the yellow metal faces resistance at 1917.97. It also becomes more limited by the 50-Day moving average at 1,905.58. As a result, the market is struggling to gain momentum. For the rally to reverse, it must clear minor resistance at 1,926.25 and the 200-Day moving average at 1,928.15. Given these indicators, market sentiment is bearish.
To be informed about the latest developments, follow us twitter ‘ in, Facebook in and Instagram Follow on and Telegram And YouTube Join our channel!


