According to technical analyst Ross Burland, the gold price is in a bullish phase. So, on the front of the bullish trend, the bulls are seeing all-time highs. Crypto analyst Rakesh Upadhyay says that Bitcoin bulls are aggressively buying the dips.
Gold technical analysis
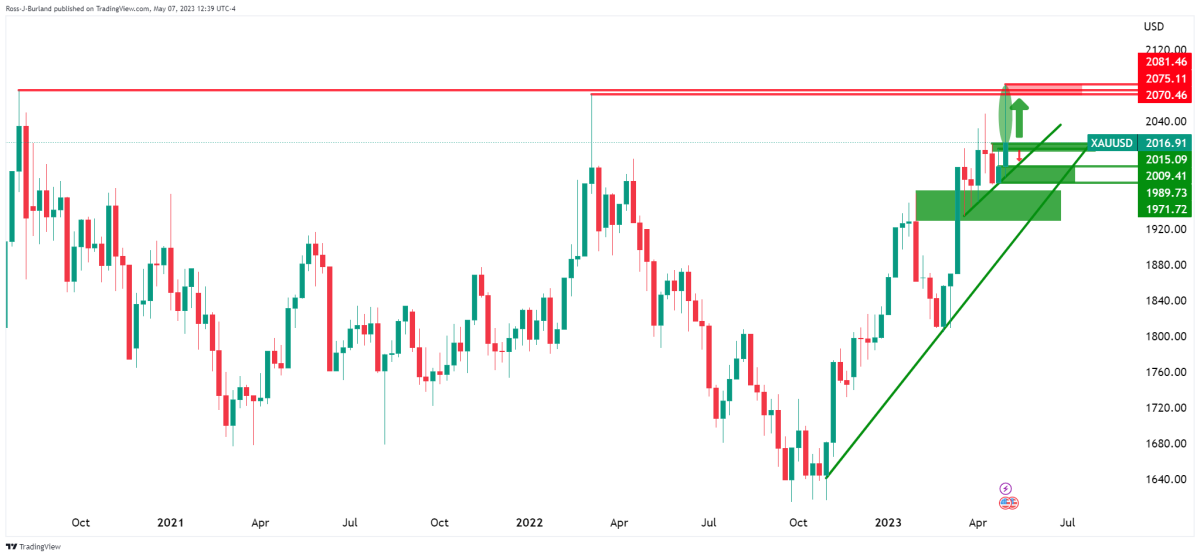
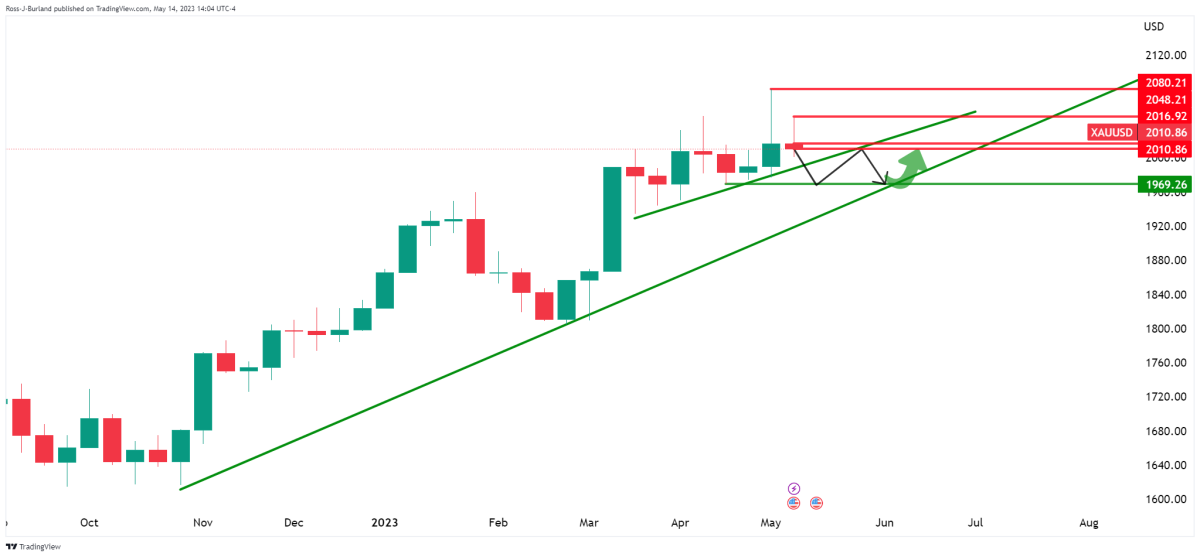
A break of $ 1,970 of gold reveals the risk of deterioration of the bull trend. In the previous week’s analysis, we mentioned that the wick of the weekly chart is full:
Update
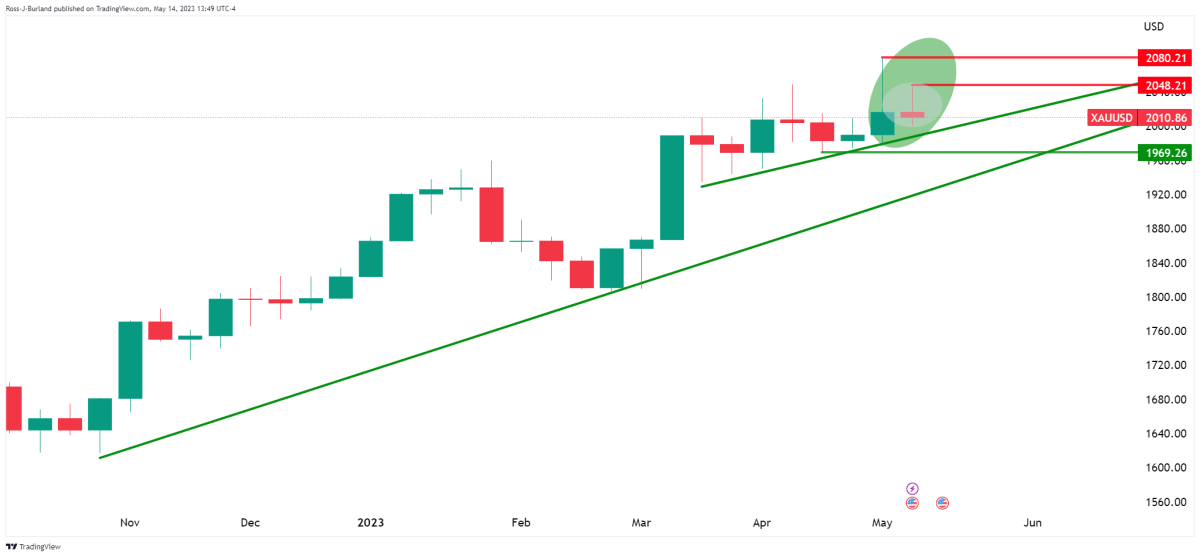
We see that the wick is partially filled and the price is still on the front of the uptrend line. Bias remains bullish.
On the daily chart, we have a support structure that can be respected on the opening days of the week and stay ahead of the uptrend line leading to another test of all-time highs.
On the other hand, a break in the support structure will risk a shift towards long positions that have accumulated in the last few months:
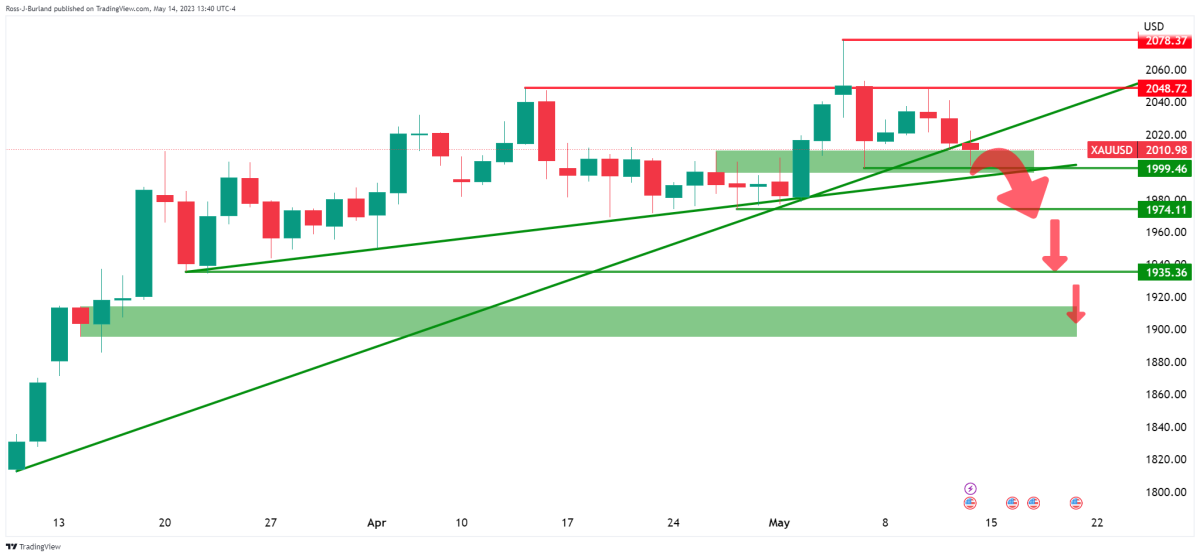
Otherwise, gold price is likely to stay in a range between $1,970 and $2,050.
The S&P 500 Index (SPX) closed the week with a nominal loss of 0.29%, but Bitcoin is aiming to end the week with a deeper drop of over 5%. Weakness in Bitcoin has dragged many altcoins down, showing that the sentiment has weakened.
Cryptocurrency market overview
Bitcoin’s solid bounce on May 12 is a silver lining. Many analysts expect Bitcoin to start its recovery. But tracking resource Material Indicators is cautious. In a recent analysis, they said it would be a worrying sign if there were no strong bids from whales at lower levels. They state that the bullish perspective will be invalidated if Bitcoin stays below the 200-week moving average.
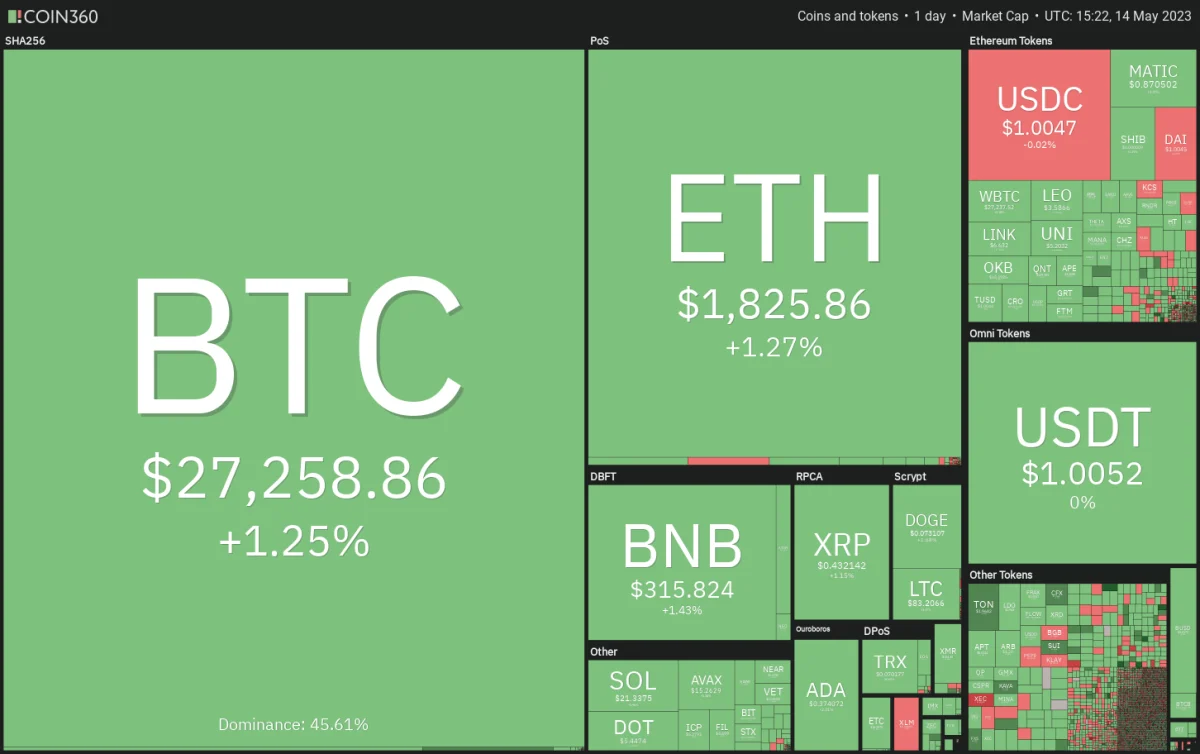 Crypto market data daily view / Source Coin360
Over the next few days, there will be debt ceiling talks between Congress leaders and the White House. Progress made here is expected to come to the fore. cryptocoin.com As you follow, the possibility of US default creates uncertainty. It is possible that these risks will keep the rise in the stock markets under control. But it’s hard to predict how Bitcoin and altcoins will react to all this chaos. Bitcoin has started a corrective phase.
Bitcoin price analysis: Bulls buy lows
The long tail on Bitcoin’s May 12 candlestick shows that the bulls are aggressively buying dips towards the neckline of the inverse head and shoulders pattern.
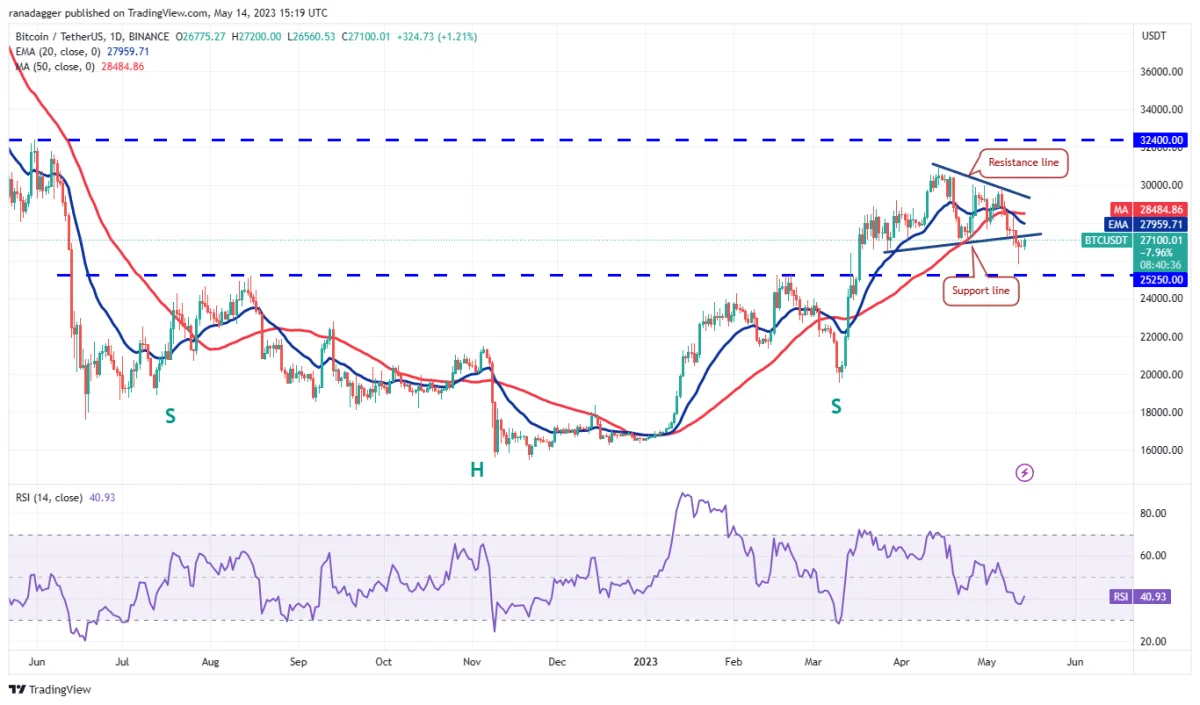 BTC daily chart / Source: TradingView
Buyers will try to push the price back into the triangle. However, it may encounter fierce resistance from bears. The downward sloping 20-day exponential moving average ($27,959) and the relative strength index below 41 suggest that the bears have a slight advantage. If the price turns down from the 20-day EMA, the bears will try to push BTC back below $25,250. If they manage to do so, the selling is likely to intensify and BTC drop to $20,000. On the upside, the bulls will need to break through the hurdle at the resistance line to regain control. It is possible for Bitcoin to retest the overhead resistance at $31,000 later.
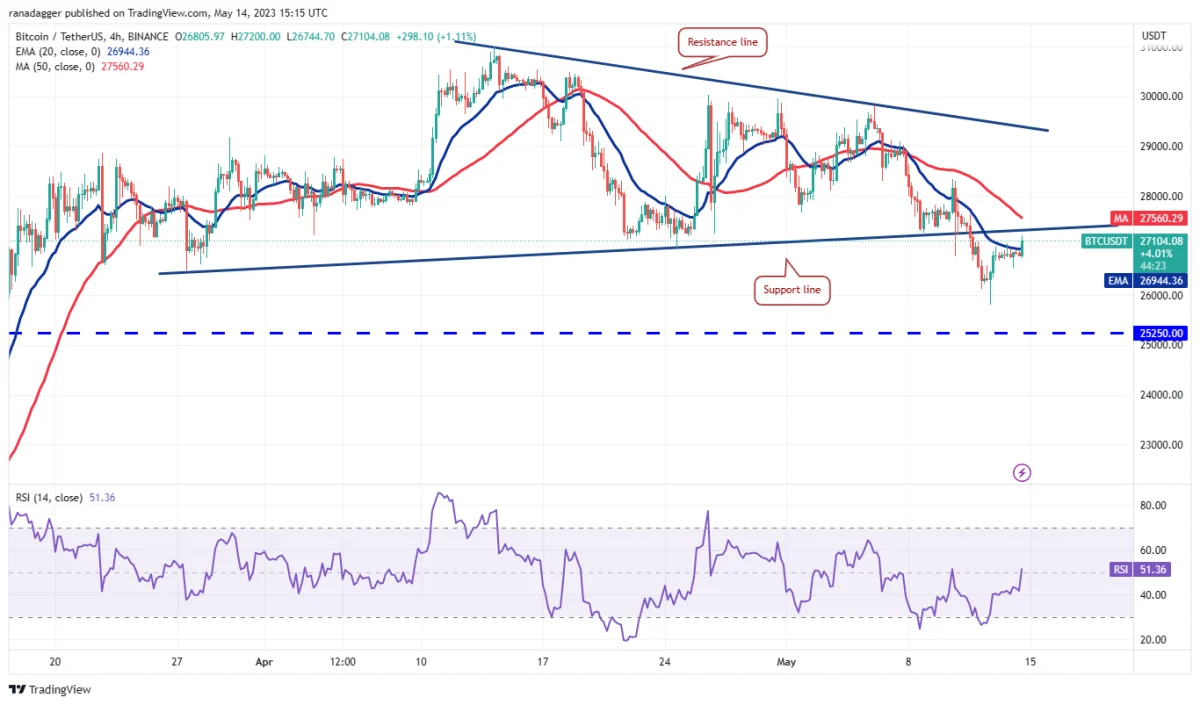 BTC 4-hour chart / Source: TradingView
The bulls surmounted this hurdle after facing stiff resistance at the 20-EMA. This shows that the bulls are trying to take control. It is possible for BTC to rise to the 50 simple moving average and then to $28,400. Conversely, if the price drops sharply from the current level, it will indicate that the bears are trying to turn the support line of the triangle into resistance. BTC is likely to drop to the crucial support at $25,250 later.