
Leading cryptocurrency analysts have warned to ‘sell’ for these 4 altcoin projects. These altcoin projects may experience a drop in the near future! Here are the details…
Leading altcoin Ethereum (ETH) can fall to the level of $ 1,700!
cryptocoin.com As we reported, Ethereum’s price struggled to surpass the $2,000 resistance zone and started a new decline. ETH traded below the $1,920 and $1,900 support levels to enter a bearish zone similar to Bitcoin. However, the price declined further, trading close to $1,840. A low low was formed near $1,843 and the price is currently consolidating losses. Momentarily, the price is trading below $1,900 and the 100 hourly Simple Moving Average. There is also a major bearish trend line forming with resistance near $1,900 on the hourly chart of ETH/USD.

An immediate resistance for ETH is near the $1,890 level. This level is close to the 50% Fib retracement level of the recent decline from the $1,936 low to $1,843 low. The next major resistance seems to be forming near the trend line and $1,900. The main resistance is near the 76.4% Fib retracement level of the recent decline from the $1,915 or $1,936 high to $1,843 low. However, a close above the $1,915 resistance zone could send Ethereum towards the $1,940 resistance.
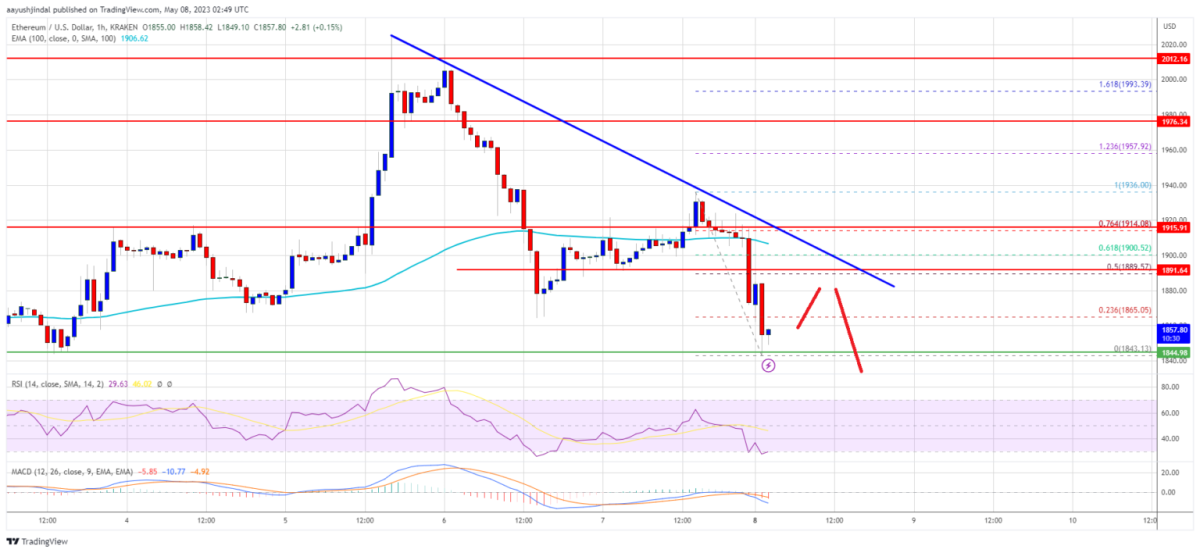
Ethereum gains above the resistance could push it to the $2,000 resistance levels. In this case, the price could even rally towards the $2050 price resistance. The next key resistance is near $2,120. But on the other hand, if Ethereum fails to break the $1,900 resistance, the downside could begin. The first level of support on the downside is located at $1,840. The next support level is $1800, and if this support level is broken, ETH could drop as low as $1,740 and further losses could push it to the $1,700 level.
Technical Indicators for Ethereum
- Hourly MACD – The MACD for ETH/USD is currently gaining momentum in the bearish zone.
- Hourly RSI – The RSI for ETH/USD is currently below the 50 level.
- Major Support Level – $1,840
- Main Resistance Level – $1,900
Critical buy-sell levels for Dogecoin (DOGE) have been announced!
After a small increase, Dogecoin price faced resistance around $0.0820. DOGE formed a high around $0.0815 and started a fresh decline, similar to Bitcoin not necessarily Ethereum. There was a clear move below the $0.0800 support for DOGE. The bears managed to push the price below the $0.0775 key support. Bottoms were formed around $0.0734 and the price is currently showing bearish signs.

DOGE is trading below the $0.080 zone. There is also a key bearish trend line forming with resistance near $0.078 on the 4-hours chart of the DOGE/USD pair and on the upside, price is facing resistance near the $0.0775 level. This level is close to the 50% Fib retracement level of the recent decline from the $0.0815 high to $0.0734 high. The next major resistance for DOGE is near the $0.078 zone and the trend line.
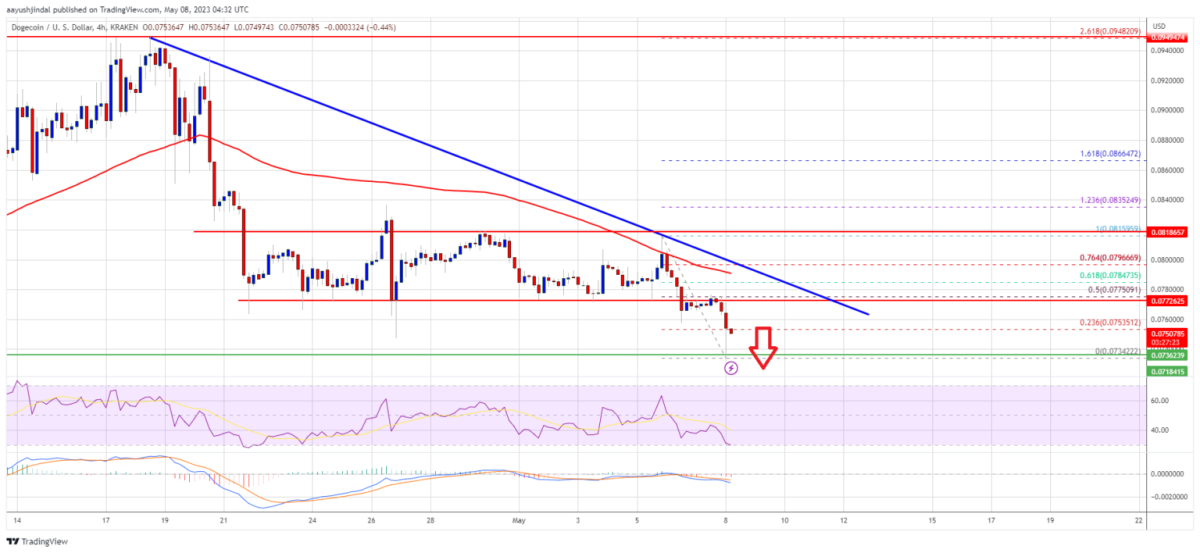
The trendline for popular meme coin DOGE is near the 100 simple moving average (4-hours) and the 61.8% Fib retracement level of the recent decline from the $0.0815 high to $0.0734 high. A close above the $0.078 resistance could send DOGE price towards the $0.082 resistance. The next major resistance is near $0.0850. Any further gains could send DOGE towards the $0.090 level.
If DOGE price fails to gain momentum above the $0.078 level, it could continue to move lower. On the downside, the first support is near the $0.0735 level, while the next major support is near the $0.0720 level. If there is a downside break below the $0.072 support, the price could decline further. In the stated case, the price could decline towards the $0.070 level.
Technical Indicators for DOGE price
- 4-Hours MACD – The MACD for DOGE/USD is currently gaining momentum in the bearish zone.
- 4-Hours RSI (Relative Strength Index) – The RSI for DOGE/USD is currently below the 50 level.
- Major Support Levels – $0.0735, $0.072 and $0.070.
- Major Resistance Levels – $0.0775, $0.0780 and $0.082.
The LUNC price is down 15 percent over the week!
In the last seven days, the Terra Luna Classic market has experienced a serious price drop and has lost more than 15 percent of its value. Prior to this bearish period, there was a week where LUNC price was relatively stable and moved sideways. However, a broader look at the market shows that the Terra Luna Classic has been on a downward trend for the past few months. Since the beginning of February, the coin has recorded a price drop of about 53 percent. According to data from CoinGecko, altcoin LUNC is currently worth $0.00009549. In the past 24 hours, the value of this cryptocurrency has dropped by about 5 percent, dropping below the significant $0.0001 level during that time.
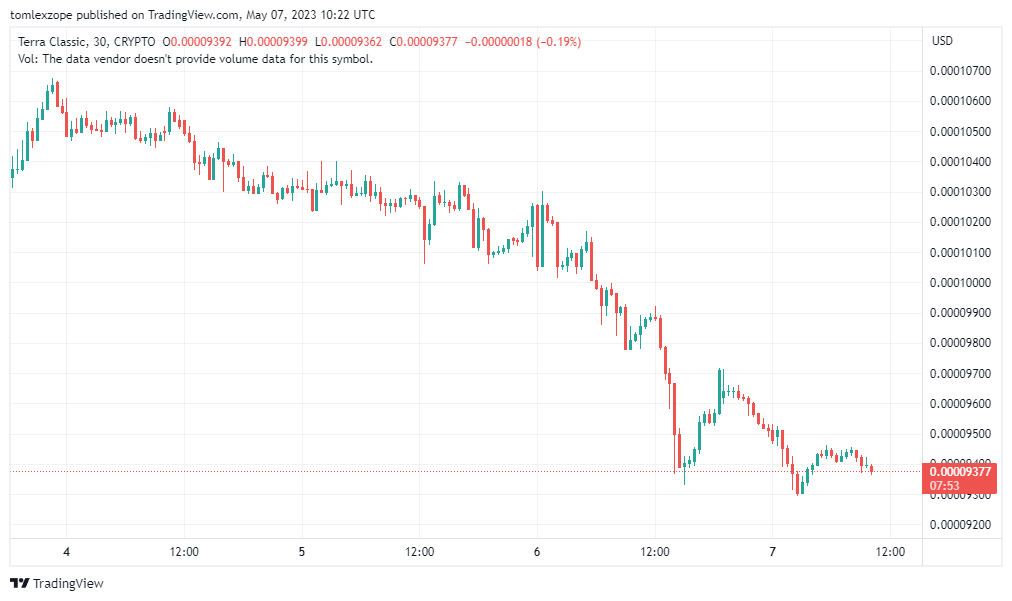
The last time the Terra Luna Classic went below this price point can be traced back to August 2022, following the collapse of the Terra ecosystem. With the $0.0001 level unable to hold, the coin will hope to rest at the next support level at $0.00009275, although the current sentiment is strongly bearish. On the other hand, the L1 Joint Task Force team completed the upgrade of the rebel-2 testnet to v2.0.0 and integrated various new features for better functionality and security. Specifically, this serves as a preliminary step towards the Terra Classic mainnet upgrade. This could trigger price action in the near future.
Experts warn of popular altcoin project Polkadot (DOT)
After hitting a yearly low of $4.22 in December 2022, DOT price recovered and moved above the 20-week moving average (MA), which is often used to identify long-term trends. This momentum helped the price retest the resistance area at $7.8 before it was rejected in the week of March 20-27. While the price held above the 20-week MA as support for the next 8 weeks, it broke this MA last week and closed below it. This is explained as a significant bearish development that indicates bears are taking over the market.

According to the data, DOT price has stayed below the 20-week MA over the past week and will likely form a bearish candlestick. If so, it could drop to a year low of $4.2, a drop of more than 20% from the current level. The RSI indicator supports this possibility as it was rejected at the 50 level and trending down.
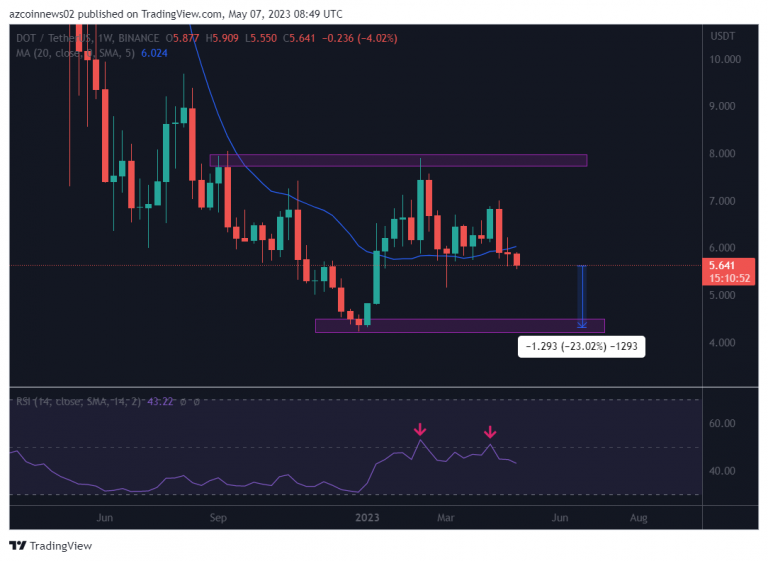
The daily chart shows that the altcoin DOT price has dropped below the ascending support line formed from the yearly low. Since this line covers the entire uptrend, its break indicates the end of the uptrend. Additionally, the price also broke below the key $5.8 key horizontal support zone, confirming the ascending support line as resistance yesterday (red arrow). Therefore, the DOT price is likely to continue falling to $5.2 in the coming days.
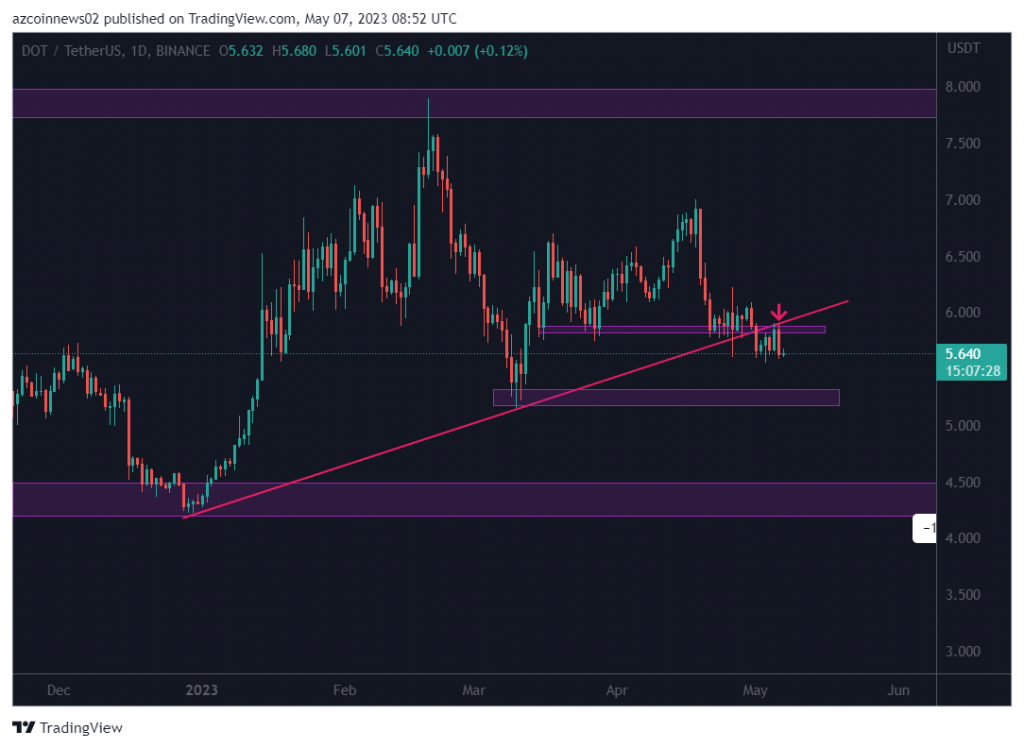
The most likely outlook, according to experts, is that the altcoin DOT price will continue to decline in May. While the closest target is $5.2, the next target is announced as $4.2.


