Popular meme coin Shiba Inu (SHIB) price fell from a key horizontal support level at 0.0000080. According to crypto analyst Valdrin Tahiri, this indicates that the long-term trend is likely bearish. Additionally, the analyst says that the data in the weekly and daily time frames are also in a downward trend.
Shiba Inu price decline continues below support
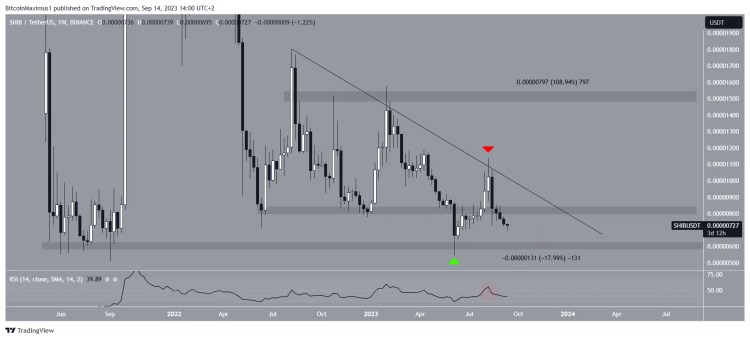
Weekly technical analysis of SHIB price shows an ongoing downward movement since August. At that time, the price was rejected by a descending resistance line (red icon). The decline caused a breakout from the $0.0000080 horizontal support area. This was a critical area as it served as support for most of the period from May 2022 to date.
Shiba Inu price is amidst the nearest support at $0.0000060. Falling to this level would mean another 18% decline. Conversely, a breakout from the $0.000080 area and the resistance line is possible that could lead to a 110% rally towards the next resistance at $0.0000150. Interestingly, despite these setbacks, Shibarium wallets reached the 1 million mark in September.
 SHIB Weekly Chart. Source: TradingView
The weekly Relative Strength Index (RSI) is showing bearish trends for the Shiba Inu. RSI is a tool traders use to measure whether a market is overbought or oversold. Data above 50 and a bullish trend indicate a favorable position for the bulls. Data below 50 shows the opposite. The RSI was rejected at the 50 line (red circle) while the price encountered resistance. Now he’s standing under it. These combined factors point to a downward trend. So, it supports a bearish outlook for the Shiba Inu price forecast.
SHIB price prediction: Meme coin is losing support!
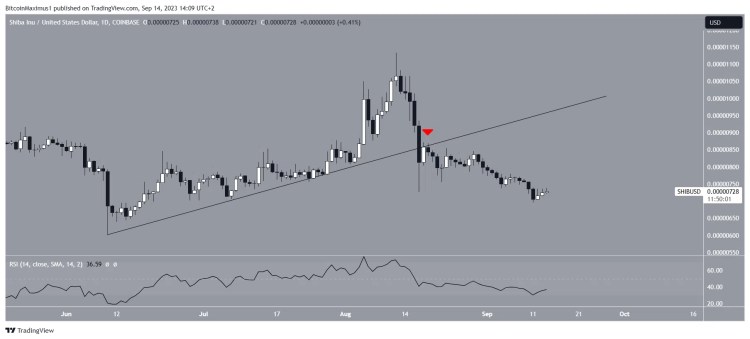
Daily data also points to a bearish trend, primarily seen in the Shiba Inu price movement. This is evident as the SHIB price has fallen below a support line that has been rising since June. On August 17, meme coin fell below this line. Moreover, it was confirmed as resistance the next day (red icon). Since then, SHIB price has been declining, forming several lower highs.
Additionally, the daily Relative Strength Index (RSI) is falling, giving a bearish signal. The index currently stands below the 50 mark. Additionally, there is no sign of a bullish divergence in the RSI. Considering these bearish indicators, the most likely future prediction for Shiba Inu price suggests a decline to the previously mentioned long-term support level of $0.0000060.
 SHIB Daily Chart. Source: TradingView
However, if SHIB manages to regain the $0.0000080 level, a continuation of the uptrend is possible. It should be noted that this will thus invalidate the previous prediction. In such a scenario, Shiba Inu price is likely to rise towards the descending resistance line at $0.000010. This represents a 32% increase from the current price.


