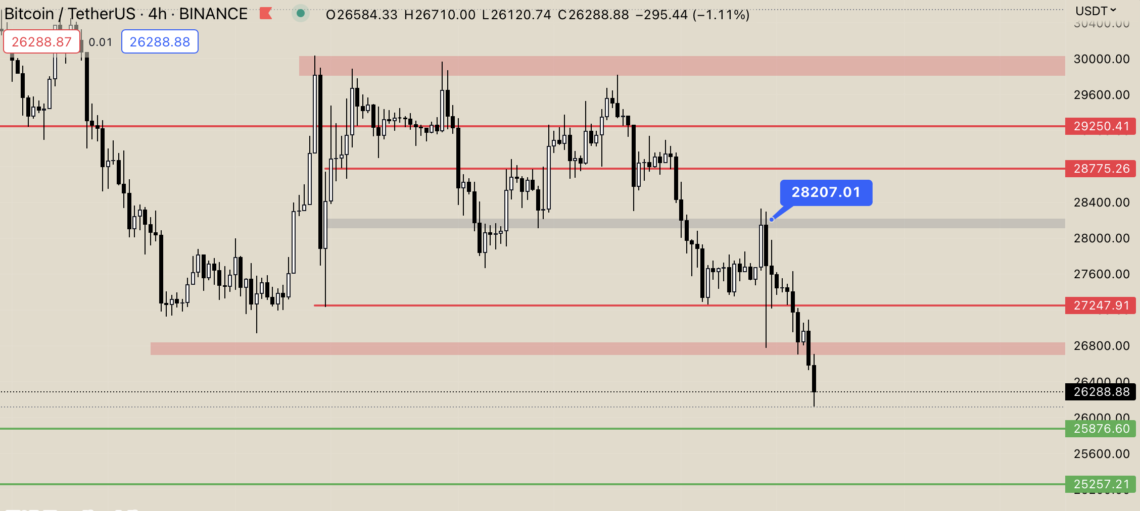
In Bitcoin (BTC), which went into a downward trend with the news that shook the market, the superiority of the sellers continues.
Losing 7.80% value in the last two days BTCshocked the crypto market. of the USA The resurgence of claims that he was selling BTC caused concern in crypto investors. Investors who use their crypto assets for sales continue to push the price of BTC down. But what about the BTC chart in line with these events?
Bitcoin (BTC) Chart Analysis
On the BTC side, the selling dominance continues. The leader of cryptocurrencies, which started to decline from $ 28,300, is currently trading at $ 26,288. The recent claims that the USA sold BTC was one of the main factors that triggered the decline. In BTC, where the supports are broken one by one, if the buyers fail to show themselves, the price may drop to $25.876 and $25,257, respectively.
The leader of cryptocurrencies, which currently finds buyers at the intermediate price, can regain strength if it exceeds $ 26,800. Decreased Fud news is one of the main criteria in order to create bullish expectations in BTC. If these conditions are met, it may be possible to target the resistances of 27.247 – 28.200 – 28.775 – 29.250 and 30.000 dollars, respectively.


