November started as a bullish month for the cryptocurrency market. However, prices stalled in the second half of the month. According to crypto analyst Valdrin Tahiri, these 3 altcoins have bullish formations. It’s also possible they could reach all-time highs in December.
SEI price forecast: A new ATH is possible!
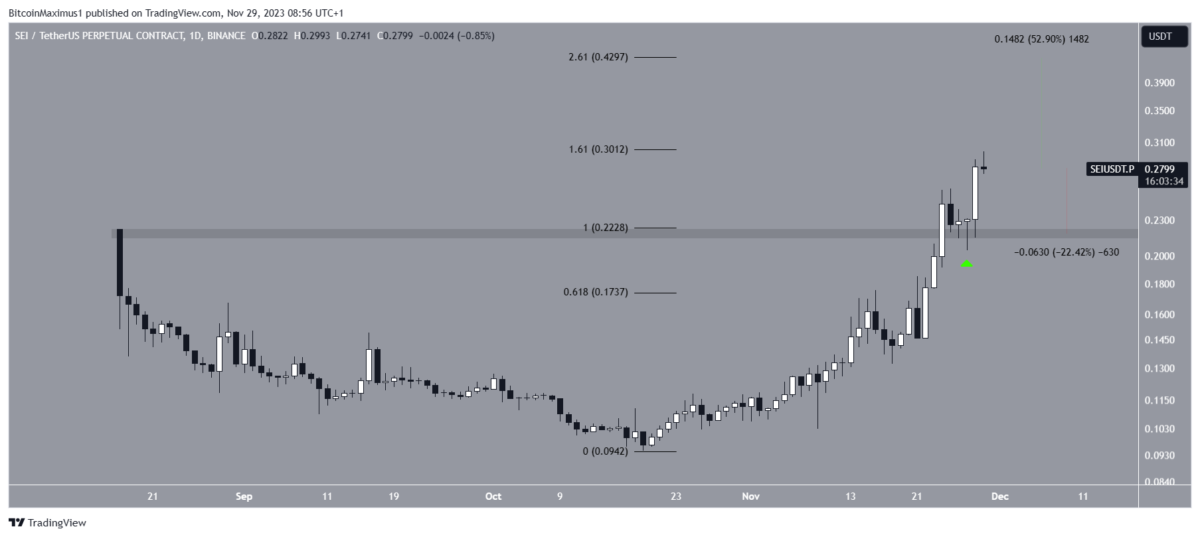
SEI price has increased rapidly since dropping to $0.095 on October 19. The upward movement gained momentum on November 22. Thus, the altcoin price broke out of a significant resistance area after two days. SEI confirmed resistance as support (green icon) on November 27 and bounced significantly thereafter. Today, the price reached its all-time high of $0.30. The high was at the 1.61 outer Fib retracement level of the previous downtrend. If the SEI rises above this, it could increase by another 50%. Thus, it is possible for the token to reach the next resistance at $0.43.
 SEI Daily Chart. Source: TradingView
Despite this bullish SEI price prediction, a rejection from the $0.30 resistance would likely lead to a 22% decline to the $0.22 horizontal support area.
TIA price prediction: Altcoin price breakout could bring ATH
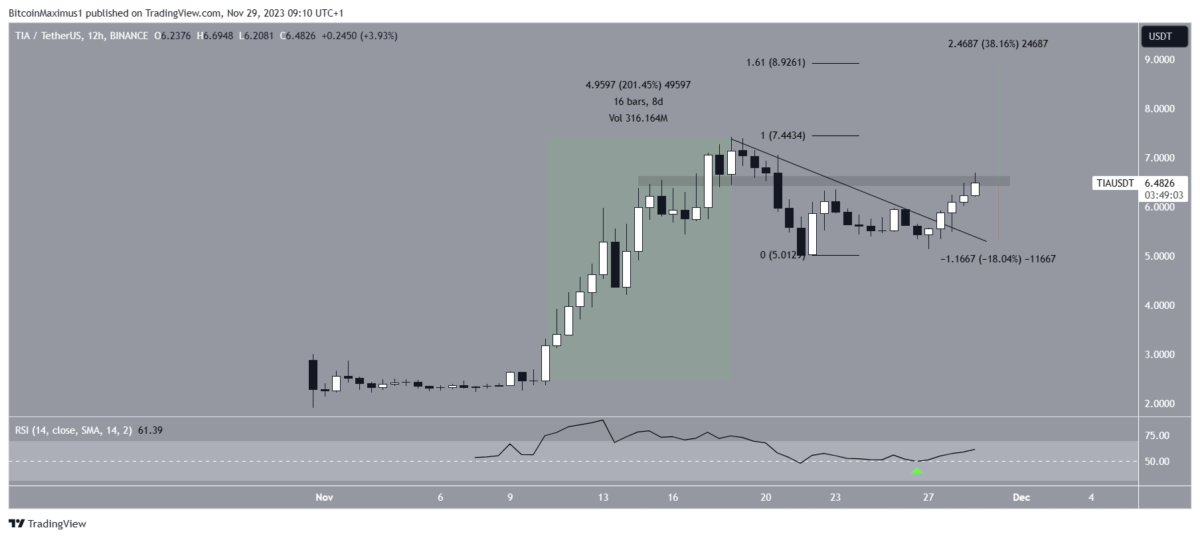
cryptokoin.com As you follow from , Celestia (TIA) price started a big increase on November 10. The price increased by 200% in 8 days. With this move, the token reached its all-time high of $7.42. Although the altcoin later experienced a slight decline, it started to rise again on November 22. Five days later, the price broke out of the descending resistance trend line, indicating the end of the correction.
With the Relative Strength Index (RSI) as a momentum indicator, investors can determine whether a market is overbought or oversold and decide whether to accumulate or sell an asset. If the RSI value is above 50 and the trend is upward, the bulls have an advantage, but if the value is below 50, the opposite is true. As the price broke out, the RSI jumped at 50 (green icon), legitimizing the move. If TIA breaks out, it is possible for it to rise 40% and reach the next resistance at $8.90.
 TIA 12-Hour Chart. Source: TradingView
Despite this bullish TIA price prediction, a rejection from the $6.50 resistance area could lead to a 20% drop to the descending resistance trend line at $5.30.
KAS price prediction: A new ATH is on the horizon for the altcoin!
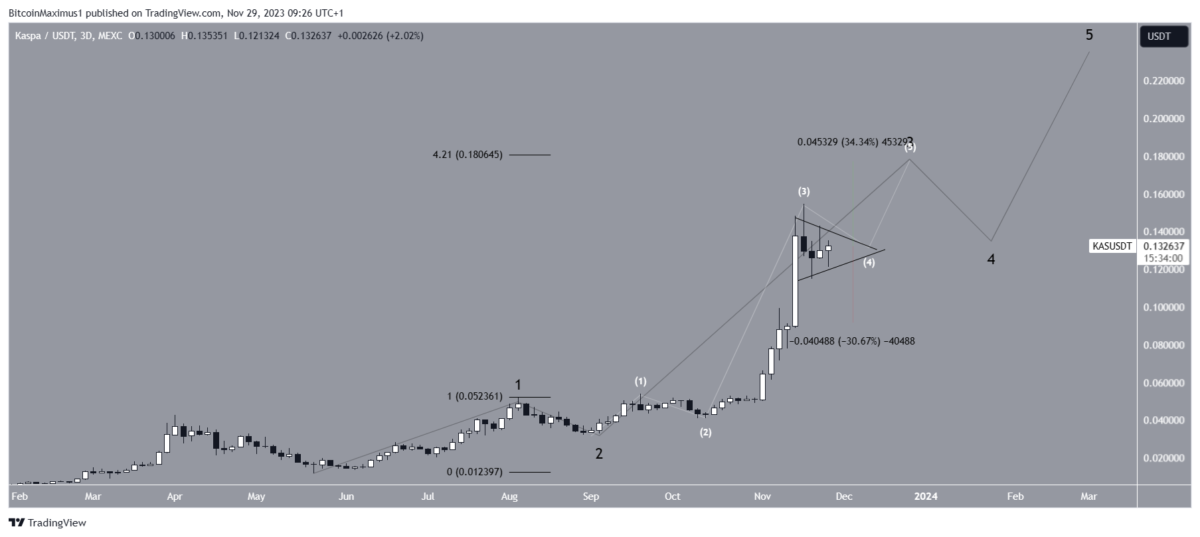
Kaspa (KAS) price has increased parabolically since the beginning of the year. The increase stopped temporarily in April. However, the price started to rise again in May, increasing the rate of increase once again. Technical analysts use Elliott Wave theory to identify recurring long-term price patterns and investor psychology, which helps them determine the direction of a trend.
The most likely count has the KAS price in the third wave of a five-wave uptrend that began in May. The lower wave number is in white. This shows that KAS is in a corrective fourth wave that takes the shape of a triangle. If the count is correct, the altcoin will break out of the triangle and reach an ATH level around $0.18.
 NOV 3 Daily Chart. Source: TradingView
Despite this bullish KAS price prediction, a breakout of the triangle will invalidate the upward move. In this case, it is possible for the altcoin price to drop to the next closest support at $0.09. Therefore, this will mean a decrease of 30%.
The opinions and predictions in the article belong to the analyst and are definitely not investment advice. We strongly recommend that you do your own research before investing.


