After forming consecutive Doji candlestick patterns on the weekly chart over the past three weeks, Bitcoin aims to end the week on a positive note. This is an early sign that the uncertainty between bulls and bears has resolved to the upside. Although the recovery is still in its early stages, the Federal Open Market Committee meeting on September 20 could increase volatility. The majority of market participants expect the Fed to maintain the status quo on interest rates. However, there may be surprises during Fed Chairman Jerome Powell’s press conference after the interest rate decision. Here is what will happen in the Bitcoin and altcoin markets at that time, according to analyst Rakesh Upadhyay…
Bitcoin price analysis: What’s next?
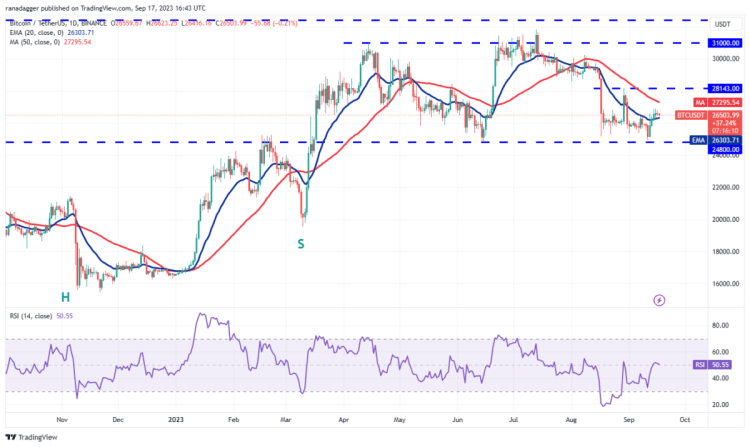
Bitcoin broke above the 20-day exponential moving average ($26,303) on September 14. Thus, it showed that the selling pressure had decreased. Since then, the bulls have thwarted the bears’ attempts to push the price below the 20-day EMA. Buyers will try to improve their advantage. This will move the BTC/USDT pair to the 50-day simple moving average ($27,295). This level presents a minor obstacle. However, if exceeded, the parity is likely to reach $28,143. The bears are expected to defend this level strongly.
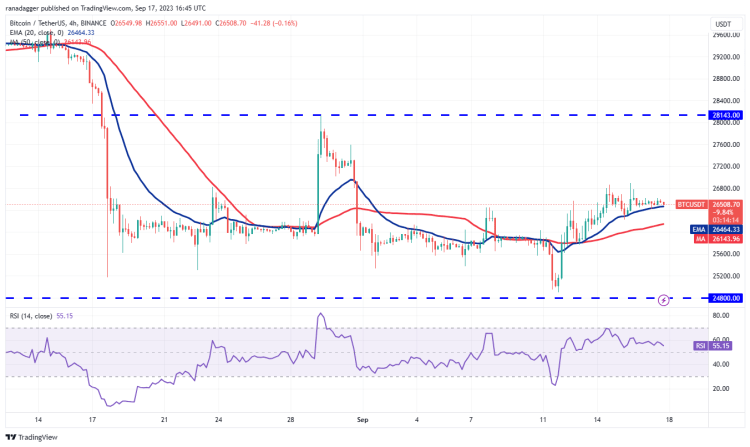
According to the analyst, if the bears want to maintain the upper hand, they will have to drop the price below the 20-day EMA. This traps aggressive bulls. It also opens the doors for a potential retest of the important $24,800 support. The altcoin is trading above the 20-EMA on the 4-hour chart. This shows that the bulls are buying on dips. This shows that traders expect the recovery to continue. If buyers clear the $26,900 hurdle, the pair rises to $27,600. Then, it has the potential to eventually rise to $28,143.
Maker price analysis: Bulls are on the move for altcoin
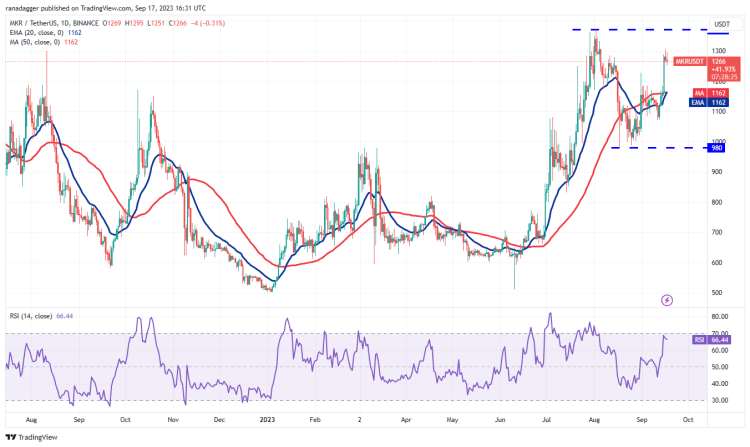
Altcoin Maker broke above the 50-day SMA ($1,162) on September 15, indicating that the bulls were trying to take control. According to the analyst, the MKR/USDT pair is heading towards $1,370. This level is likely to witness a tough struggle between bulls and bears. If the bulls do not give up too much from this level, the possibility of a breakout above this level increases. If this happens, the pair gains momentum and rises towards $1,759. The most important level to watch on the downside is the 20-day EMA ($1,162). If this level is broken, it would indicate that the pair could swing between $980 and $1,370 for a while.
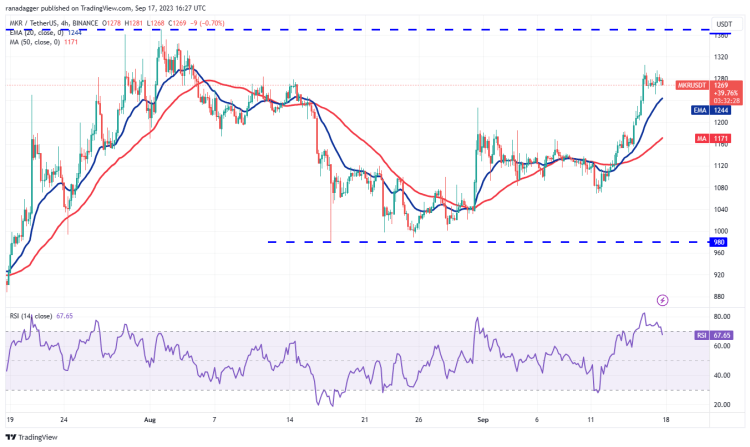
The 4-hour chart shows the bulls remaining in command but the RSI close to the overbought zone indicates a minor correction or consolidation in the near term. The 20-EMA remains the key level to watch on the downside. A break and close below this indicates the beginning of a deeper correction towards the 50-SMA. Instead, if the price bounces off the 20-EMA, it would be a sign that the bulls continue to buy dips. This would start a rally towards the stiff overhead resistance at $1,370.
Aave price analysis: Which levels are important?
Aave broke above the moving averages on September 16, indicating that the bulls were on the move. However, the long wick on the day’s candlestick indicates selling at higher levels. A slight advantage in favor of the bulls is that they are not allowing the bears to make a comeback and are again trying to keep the price above the 50-day SMA ($59). If they succeed, the AAVE/USDT pair will likely accelerate towards $70 and then $76.
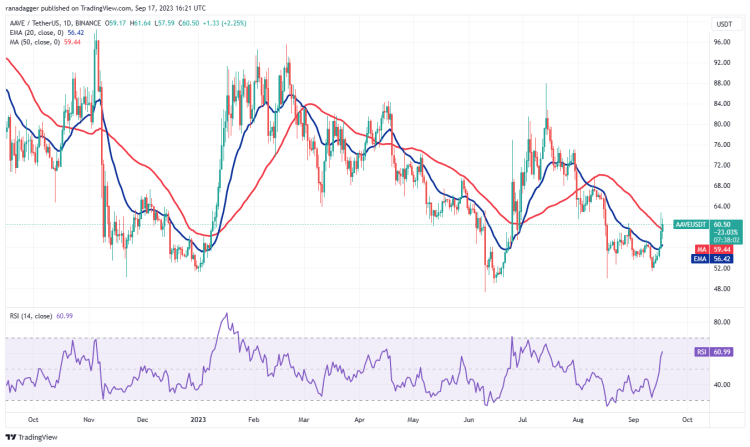
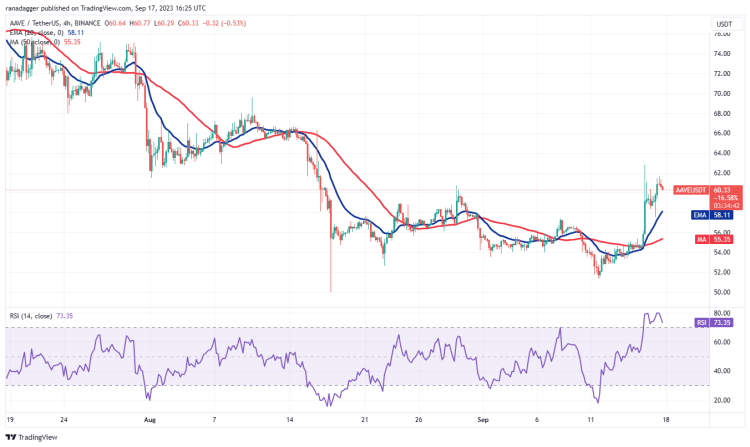
The 20-day EMA ($56) is an important support to keep an eye on in the near term. If the altcoin falls below this level, it will indicate that the bears are active at higher levels. This would drop the pair to the solid support of $48. The 4-hour chart shows that the bulls recently bought the pullback to the 20-EMA and sentiment turned positive. Buyers will try to push the price above the $63 resistance. If they can achieve this, the pair will rise to $70.
THORChain price analysis
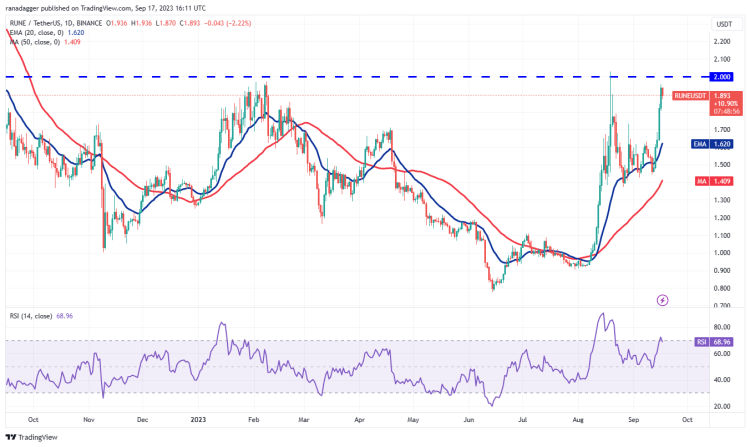
THORChain has made a smart recovery over the past few days, which shows that buyers are trying to make a comeback. The bullish move is approaching solid resistance at $2, which is likely to act as a major roadblock. If the price drops sharply from $2, this will indicate that the bulls are rushing towards the exit. This pushes the price down to the 20-day EMA ($1.62). On the contrary, if the RUNE/USDT pair does not give up too much from the current level, it will indicate that the bulls are holding their positions as they expect the rally to extend further. If $2, the pair starts a new uptrend towards $2.30 and then $2.80.
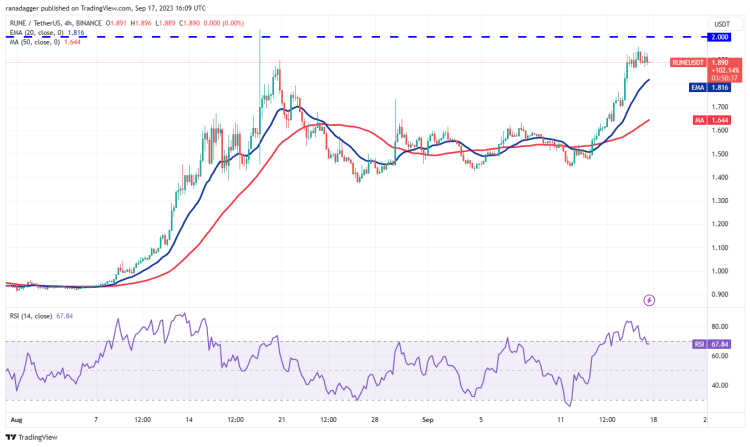
The 4-hour chart shows the $2 level acting as resistance. The price pulls back to the 20-EMA, which is likely to act as a strong support. If the price recovers strongly from this level, the bulls will again try to overcome the $2 barrier. If they manage to do this, the pair will rally towards $2.30. The first sign of weakness will be a breakout and close below the 20-EMA.
Last altcoin on the list: RNDR
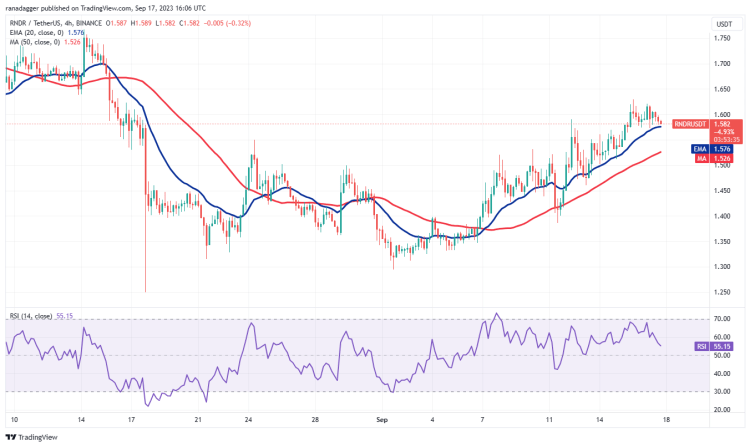
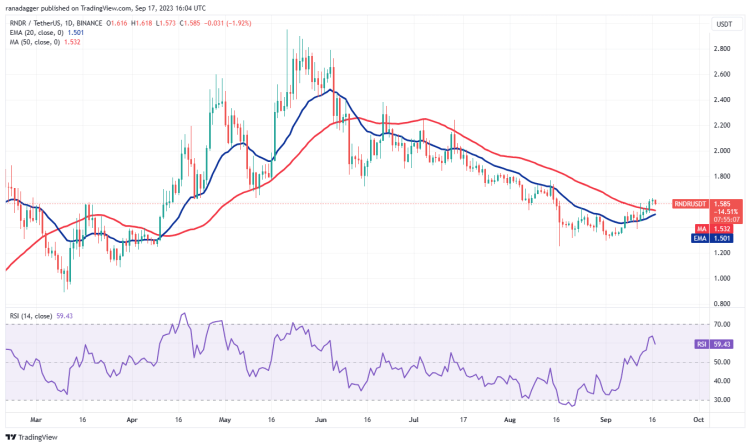
Render (RNDR) broke above the 50-day SMA ($1.58) on September 15, indicating that selling pressure may decrease. The moving averages are on the verge of a bullish crossover and the RSI is in positive territory, indicating that the bulls have a slight advantage. If the price turns up from the 20-day EMA ($1.50), it will signal a change in sentiment from selling on rallies to buying on dips. This would initiate a stronger recovery towards $1.83 and then $2.20. This positive view may become invalid in the near term if the price continues to decline and breaks below the moving averages. The RNDR/USDT pair then drops to $1.38 and then to $1.29.
The moving averages on the 4-hour chart are upward sloping and the RSI is in the positive territory. This points to an advantage for buyers. The first support to watch on the downside is the 20-EMA. If the price turns up from this level, it will indicate that the bulls continue to view declines as a buying opportunity. This increases the possibility of a rise to $1.77. However, it is an important level for the bulls to defend as falling below it would drop the pair to $1.39.
