Cryptocurrency analysts announced 4 altcoin projects to watch out for this week. According to analysts, Decentraland (MANA), Maker (MKR), Zcash (ZEC) and KuCoin Token (KCS) may attempt a relief rally that could trigger a rebound in prices.
Bear market rallies may offer trading opportunity for altcoin projects
Investors had a relatively quiet weekend following the Terra (LUNA) crash. As macro factors are not supportive, some analysts expect the recovery in altcoin projects to be rather slow. Crypto research firm Delphi Digital said in a recent report that the rally in the US dollar index (DXY) pushed its 14-month relative strength index above 70 for the first time from late 2014 to 2016. Historically, 11 of 14 such cases had caused DXY to increase by about 5.7 percent in the following 12 months. The fact that the inverse correlation between DXY and Bitcoin remains intact could pose problems for both Bitcoin (BTC) and altcoin investors.

Former CEO of BitMEX, Arthur Hayes, said in a recent blog post that the crypto markets should be given time to recover after the massive drops. While the crypto markets are bearish, periodic bear market rallies can offer short-term buying and selling opportunities. As Kriptokoin.com, we are presenting the charts and analyst views of the top 4 altcoin projects that may jump if the sentiment improves.
Here are the 4 altcoins that analysts are following this week:
Decentraland (MANA)
Decentraland (MANA) has been in a strong downward trend for the past few days. The bulls aggressively defended the May 12 drop to $0.60 and recovered to $1.36. If the price drops sharply from the current level, the bears will try to retest the support at $0.60. A break and close below this level could indicate the resumption of the downtrend. MANA could then extend its decline to the psychological level of $0.50. Conversely, if the bulls do not give up on the current level, it will indicate that investors are buying at the bottoms. This could increase the likelihood of a break above $1.36. If the scenario materializes, MANA could rise to $1.94.
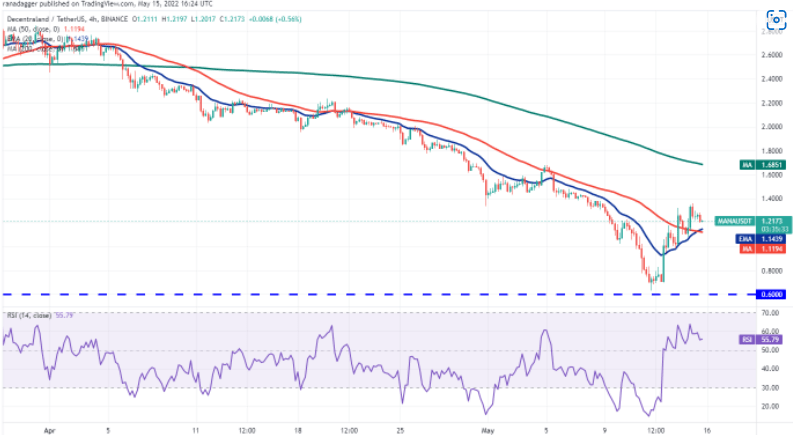
4 Hourly chart, the strong recovery from 0.60 level exceeded $1.94. Although the bears tried to pull MANA down, the bulls bought the bottoms at $1.36. This indicates that the bulls are attempting a reversal. Buyers will now try to push the price towards the 200-SMA, which is likely to act as a strong resistance. Contrary to this assumption, if the price drops from the current level and breaks below the 20-EMA, it will indicate that the bears are active at higher levels. This could bring the price down to $0.95. If this level is broken, the pair could retest the critical support at $0.60.
KuCoin Token (KCS)
KuCoin Token (KCS) rebounded sharply from the strong support at $9 on May 12. The relief rally broke above the initial hurdle at the 38.2% Fibonacci retracement level at $12.89, which is a mild positive. The KCS/USDT pair could then rally to the 50 percent retracement level at $14.95 and then rise to the critical overhead resistance at the 20-day EMA ($15.45). This is an important level to watch out for, as a break above it could signal the end of the downtrend. Contrary to this assumption, if the price drops sharply from the current level, the bears will try to push the pair below the critical support at $9. If this level is broken, the pair could resume its downtrend and drop to $5 and then $4.40. Looking at the
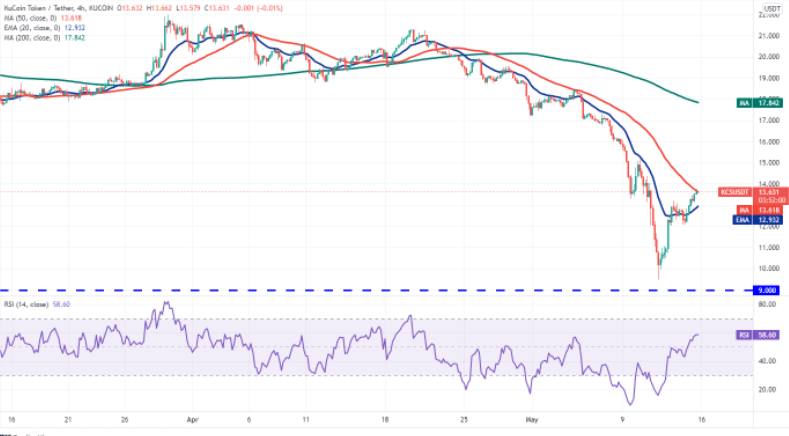
4 Hourly chart, the bulls pushed the price towards the 50-SMA, which signals a strong reversal attempt. The 20-EMA has gradually started to rise and the RSI indicator has jumped into the positive territory, indicating that the path of least resistance is to the upside. If the bulls push the price above the 50-SMA, the pair could rally to $15. If the buyers break this hurdle, the bullish momentum could increase further. This positive view could be invalidated in the short term if the price breaks from the 50-SMA and drops below $12. The bears will then try to sink the pair to the strong $9 support.
Maker (MKR)
Maker (MKR) bounced the psychological support at $1,000 on May 12, showing that the bulls are defending this level with all their might. The bulls pushed the price to the 50-day SMA ($1,754) on May 13, but the long wick on the day’s candlestick shows strong selling at higher levels. However, the positive point is that the bulls continue their relief rally on May 13. The 20-day EMA ($1,440) has started to rise and the RSI is just above the midpoint, giving buyers a small advantage. The bulls will try to push the price above $1,753. If successful, they will pave the way for a possible rally to $2,179 200-days. Alternatively, if the price breaks from the current level or $1,754, it will suggest strong selling at the higher levels. The bullish momentum could weaken if the bears push and sustain the price below $1,440. Looking at the 4-hour chart
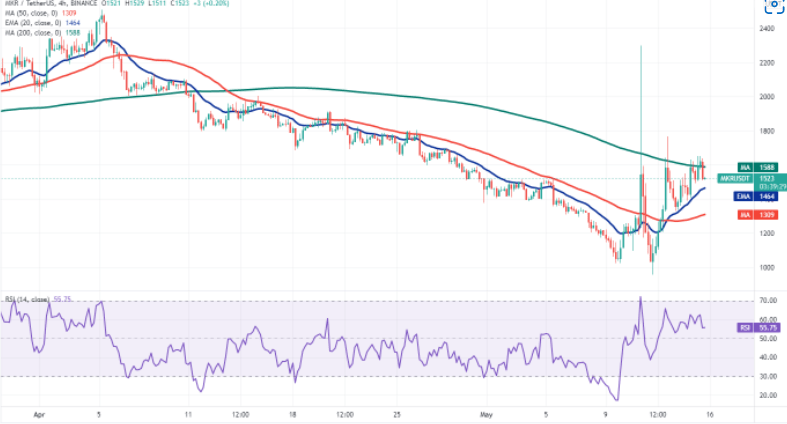
, the 200-SMA is repeatedly acting as a strong resistance, but a positive sign is if the bulls are buying dips to the 20-EMA. This indicates a change in sentiment, from selling on rallies to buying on dips. If buyers hold the price above the 200-SMA, the MKR/USDT pair could gain momentum and rally to $1,800 and later to $1,900. Conversely, if the price declines from the current level and breaks below the 20-EMA, the pair could drop to the 50-SMA.
The last altcoin on the list Zcash (ZEC)
Zcash (ZEC) has successfully held the strong support at $81 over the past few days. Although the bears pushed the price below this support on May 11 and 12, they failed to sustain the lows. This indicates strong demand from the bulls. The ZEC/USDT pair can now rise to the 20-day EMA ($114). This level had been a strong barrier during the previous pullback on May 5. Therefore, the bears will try to stop the recovery at the 20-day EMA. If they do, the price could decline again towards the critical support at $81. The bears will have to hold the price below this level to start the next leg of the downtrend.
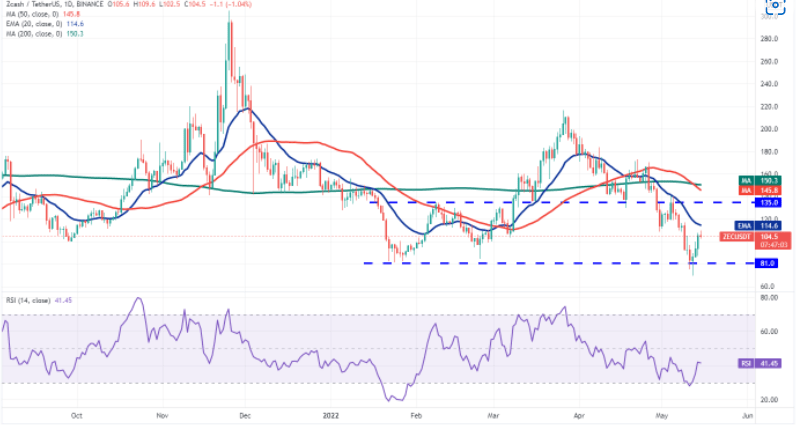
Alternatively, if the bulls push the price above the 20-day EMA, the pair could rally to $135 where the bears can form a strong defense. The bulls will have to push the price above the 200-day SMA ($150) to signal a potential change in trend.
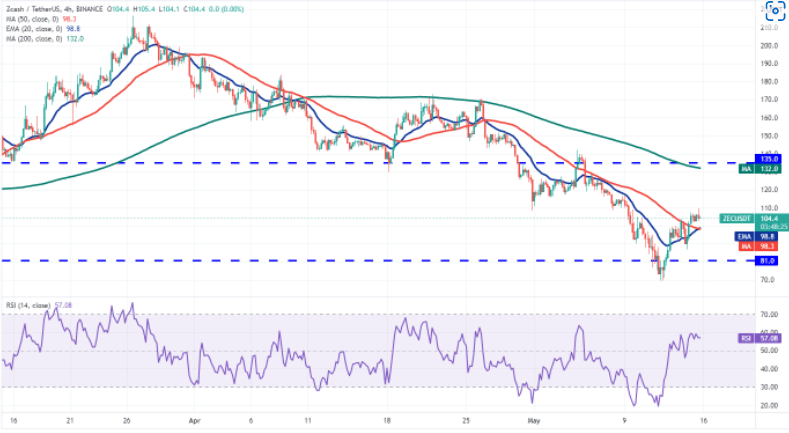
4 Looking at the hourly chart, Demand remains intact at higher levels. The 20-EMA has started to shine and the RSI indicator is hovering in the positive territory, indicating that the sellers may be losing control. Buyers may face resistance in the area between $108 and $116, but if they clear this hurdle, the recovery could reach $135. On the downside, the first sign of weakness will be a break and a close below $87. This could open the doors for a retest of the critical support zone of $81 to $69. A break and close below $69 could indicate a resumption of the downtrend.