LUNA 2.0 price has been in a downtrend since May 30. It finally reached a critical support level. This indicates that a reversal is likely. FXStreet analyst Akash Girimath says that if this support zone is maintained, LUNA price could do 4x.
These indicators suggest Terra will quadruple
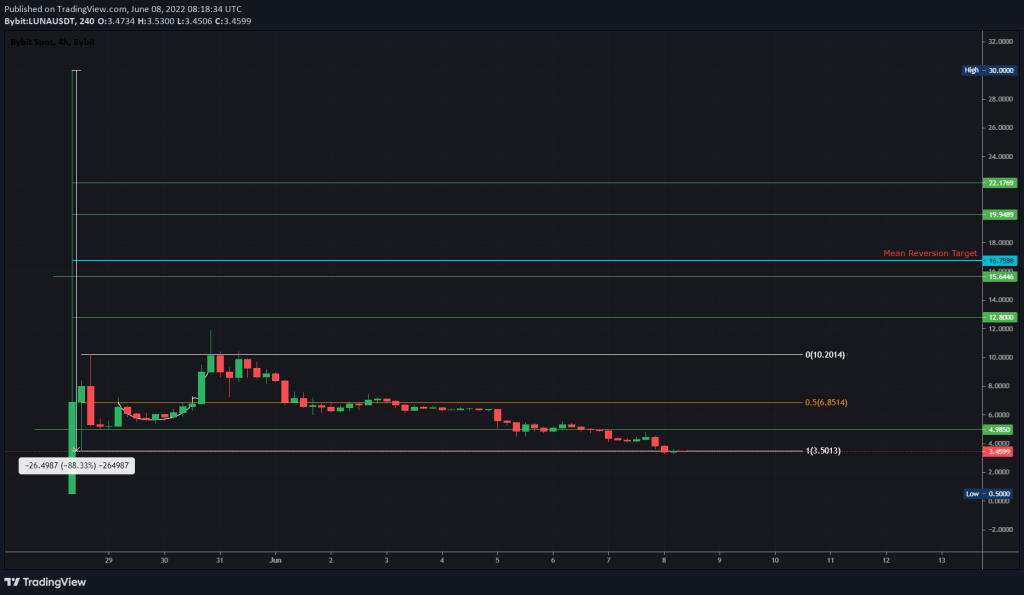
LUNA 2.0 price has finally swept the lower boundary of the $3.50 to $10.20 range created on May 28. Analysts had expected LUNA to make a U-turn after a short move above the high range on May 30. As of June 8, LUNA has officially reached the $3.50 support level. Thus, it showed that the trend change is imminent. Looking forward, if the range is to hold, the LUNA should quickly recover from $3.50 and reach higher highs.

Cryptokoin.com , the first stop of this move is $6.85, which is the mid-point of the range. This increase means an increase of 96%. However, the ideal scenario is for the LUNA 2.0 price to try to revisit the high range above $10.20.
This rise will represent a gain of 190%. However, considering the brutal selling at $30 ATH, the $10.24 level is not a good place to rest. If the bulls have high faith, they can push the LUNA 2.0 price to return to the average. Drawing a Fibonacci retracement tool from $30 to $3.50 shows that the midpoint of this collapse is around $16.75. From the current position, this will result in a 392% gain for the average investor.
LUNA/USDT 1-hour chart analysis
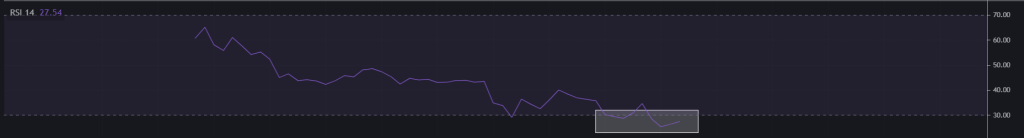
The indicator that further supports a trend change for LUNA 2.0 price: RSI. This index is a momentum-based oscillator that helps monitor both current and historical strengths and weaknesses of a particular market.
After a massive crash, the RSI is hovering below 30, also known as the oversold zone. Often times, when an asset reaches the oversold zone, there is a shift in momentum from the bears to the bulls. This suggests that buyers have taken over. As a result, this leads to a price reversal of the underlying asset. Interestingly, this outlook is bearish, with techniques predicting a change in trend following the sweep of the low-$3.50 range.
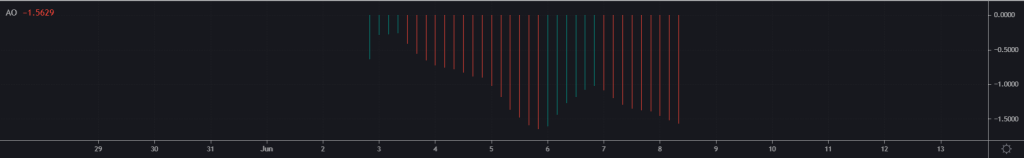
Adding confidence to the optimistic narrative for LUNA price is the Awesome Oscillator indicator used to measure market momentum. More importantly, this indicator forms ‘bullish twin peaks’.
Bull twin peaks occur when there are two peaks below the zero line. The second peak is higher than the first peak and is followed by a green bar. In addition, the trough between the two peaks must lie below the zero line. But the Awesome Oscillator for LUNA 2.0 has yet to print a green streak at the second peak.
Investors interpret this chart as excessively bullish for Terra 2.0 price. However, only a daily candlestick near $3.50 will invalidate the bullish argument. In such a case, Terra will drop below $0.50.