
Solana (SOL) suffered a price loss on May 26 and continues its downtrend as the crypto market experiences a wider pullback. Analyst opinions are frightening. Here are the details…
These levels are critical for Solana
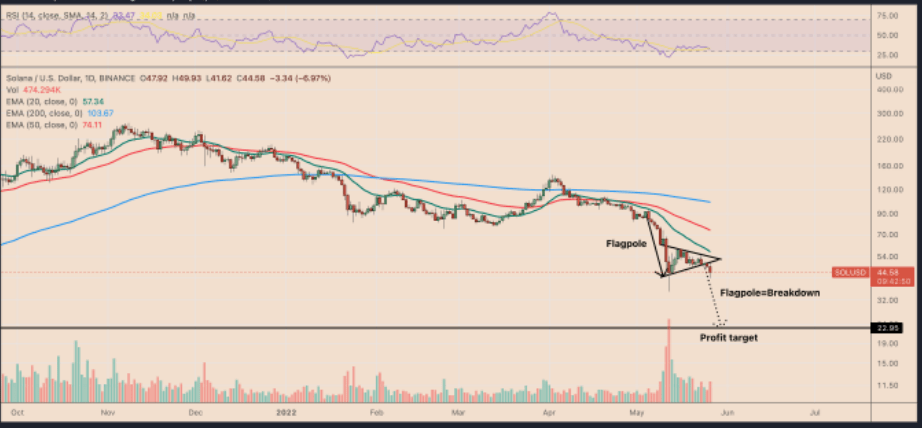
Solana (SOL) price dropped to $41.60, the lowest level in two weeks, with a loss of over 13 percent. In particular, the SOL/USD pair has emerged a bearish pennant, a classic technical pattern whose formations typically precede additional bearish moves in a market. In detail, bearish pennants appear when price trades within a range defined by falling trendline resistance and ascending trendline support. These patterns are resolved after the price drops below the lower trendline along with higher volumes. As a rule of thumb of technical analysis, traders decide on the pennant’s profit target after adding the lower length of the previous leg (called the “flagpole”) to the breakout point.
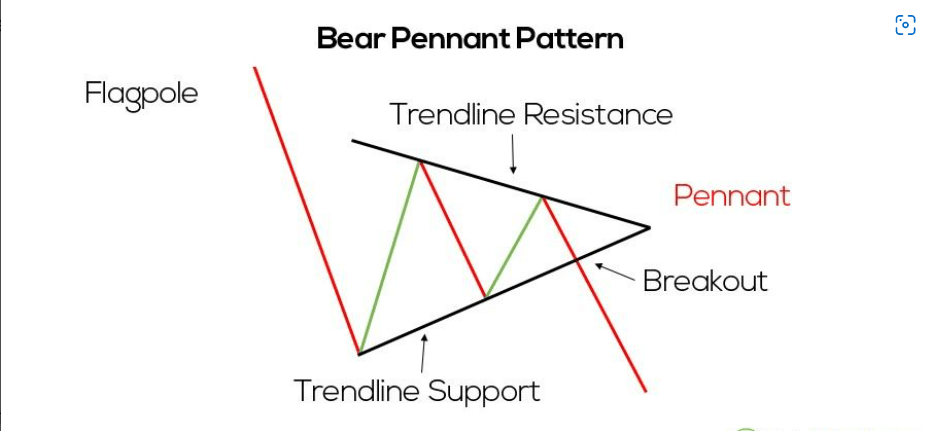
SOL is experiencing a similar breakout after closing below the lower trendline of the pennant on May 25. In theory, Solana’s profit target is close to $23, down about 45 percent from its May 26 price. However, the bearish pennant breakout of the SOL appears without an increase in volumes, suggesting that investors are not fully convinced of the move.
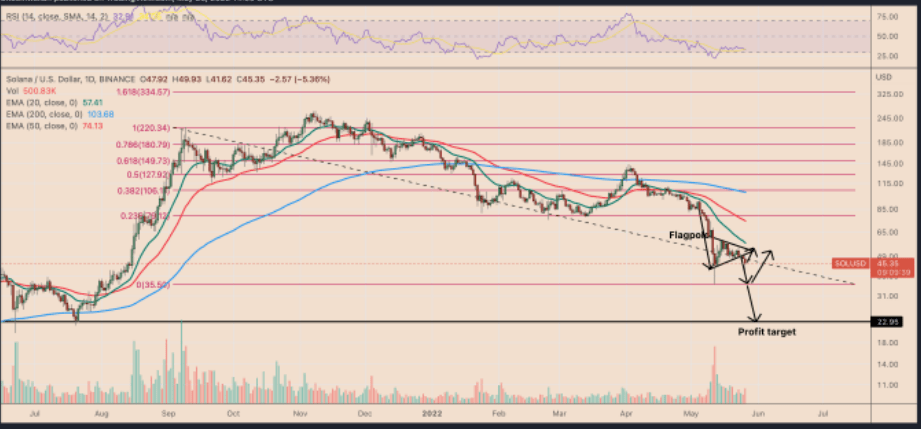
This may prompt the token to retest the lower trendline of the pennant as resistance. Also, a successful retake of the trendline as support risks invalidating the bearish pennant setup, while placing the 20-day exponential moving average (20-day EMA; green wave) at $57.59 as the next upside target. Conversely, a pullback could keep an eye on SOL’s profit target near $23, and the price floor could act as temporary support before a sharp rebound at $35.50 on May 12.
This level could be the entry point for traders
SOL also has a support confluence of multi-month horizontal and ascending trendlines. trades close. As we reported on cryptokoin.com, the horizontal trendline near $45.75 acted as resistance from April to August 2021 and then reversed between January 2022 and March 2022 to form support. At the same time, the ascending trendline is limiting the long bearish attempts of SOL since March 2021.
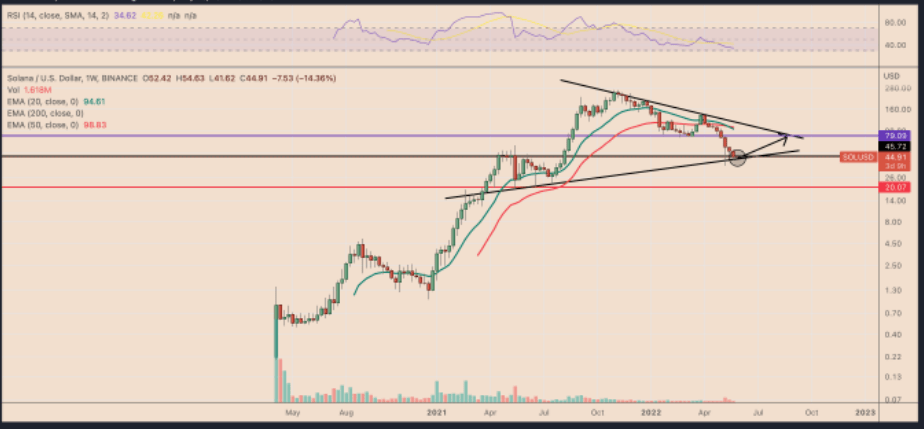
When the two trendlines converge, they can become a psychological entry point for traders with a long-term upside outlook. This means the SOL is recovering near its next upside target at $79, which also coincides with the falling trendline resistance for several months. On the other hand, a continued sell-off in the Solana market would risk another major downside for SOL, as discussed in the bear pennant setup above.