
The SEC’s crackdown on Kraken has sent a shockwave throughout the crypto industry. Along with it, the buy-sell level of BTC, AVAX and other altcoins was determined. cryptocoin.comWe have compiled the buy and sell levels of BTC and other altcoins for you.
SEC chief made statements about the stock market
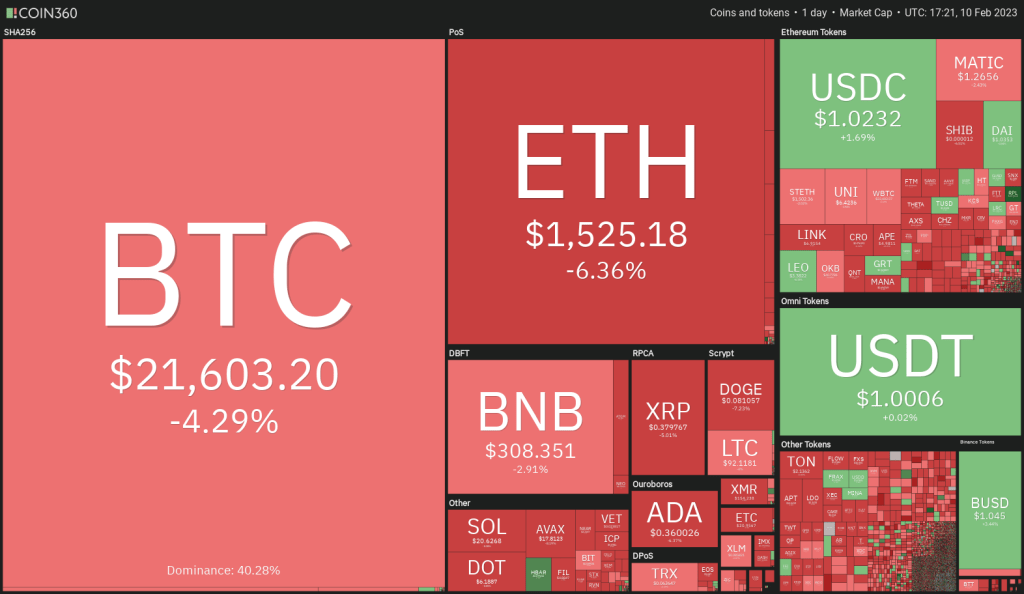
On February 9, Gary Gensler, chairman of the United States Securities and Exchange Commission (SEC), explained why the regulator forced Kraken cryptocurrency exchange to cease its crypto staking program for US customers. This news may have shaken crypto investors and they sold aggressively. Bitcoin fell about 4% on February 10, and several altcoins did the same.
The new round of selling is causing traders to wonder if the bear market is continuing or if the drop could be interpreted as a buying opportunity. This question may bother investors, but for now, the correction appears to be a normal correction phase, with cryptocurrencies returning some of their gains in January. However, it would be prudent to wait for the correction to end and a bottom to be confirmed before considering new purchases.
Trade levels for BTC, AVAX and 8 other altcoins
BTC/USDT
The $22,800 support was broken on February 9 and Bitcoin dropped to the strong support near $21,480. The absence of a strong bounce at this level indicates that the correction may go deeper.
Below $21,480, selling could accelerate and the BTC/USDT pair could drop to the moving averages. The relative strength index (RSI) has slipped into negative territory, showing the bears trying to gain an edge in the near term.
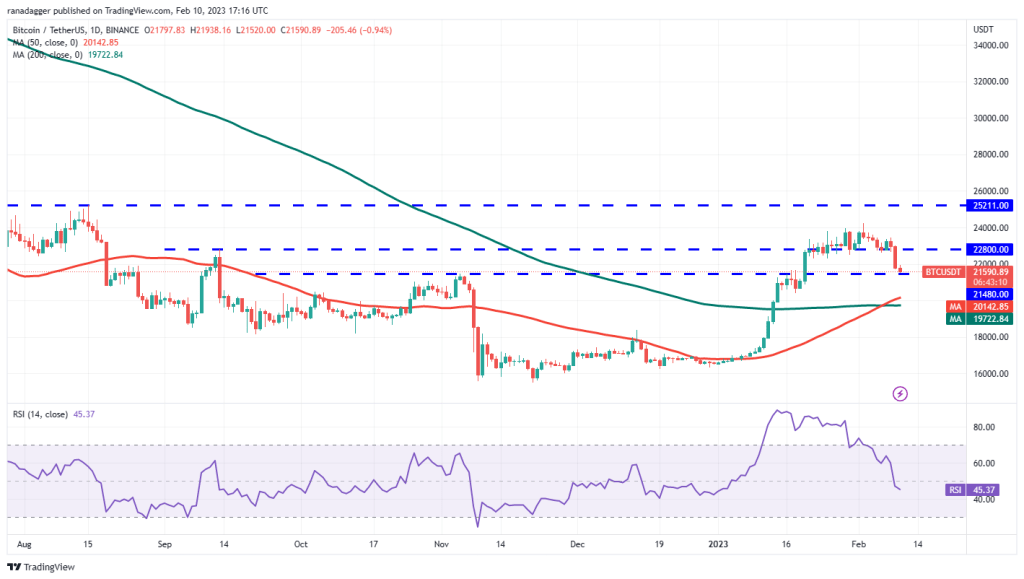
The moving averages have completed the golden cross, but the bulls need to turn the 200-day simple moving average ($19,722) to support if they want to stay in the game.
A strong recovery from the zone between $21,480 and the 200-day SMA will indicate that the bulls are attempting to form a higher bottom. The pair could gradually return to $24,255 later on. The bulls will need to surpass the $25,211 resistance to suggest that the downtrend is over.
ETH/USDT
The bears did not allow Ether to stay above the $1,680 level, which may have spurred short-term bulls to take profits.
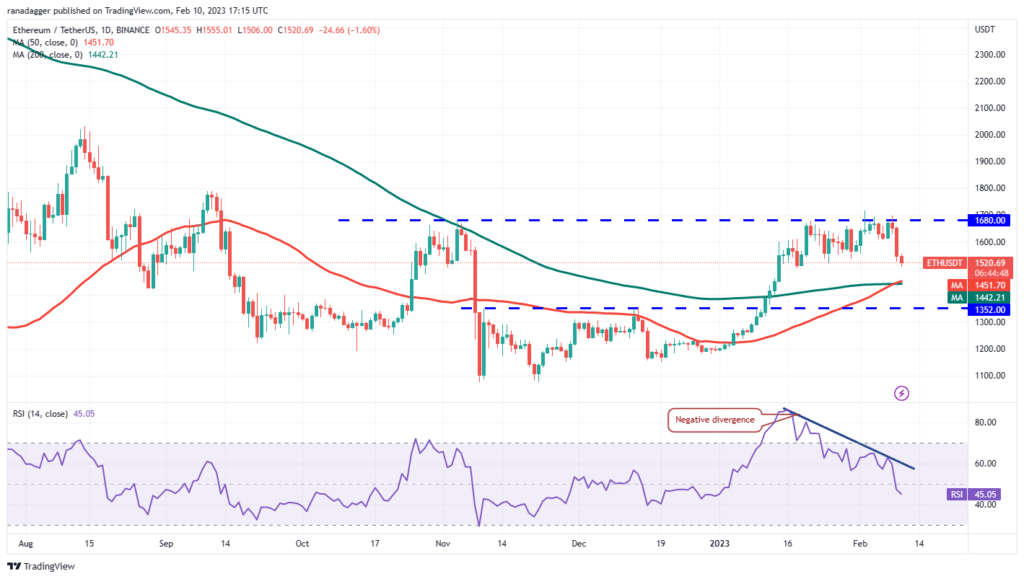
The moving averages have completed a golden cross that signals a potential trend change, but the bears are unlikely to give up without a fight. Sellers will try to push the price below the moving averages and trap the aggressive bulls. If they manage to do so, the sell-off could intensify and a drop to $1,200 is possible.
Instead, if the price rises from the moving averages, it will indicate that the bulls are attempting to turn the 200-day SMA ($1,442) to support. The bulls will then make another attempt to push the price above $1,680 and gain control. The ETH/USDT pair could then head north towards $2,000.
BNB/USDT
On February 9, BNB dived nose-to-nose below the $318 breakout level, which showed aggressive selling at higher levels. This clears a possible bearish path to the 200-day SMA ($287).
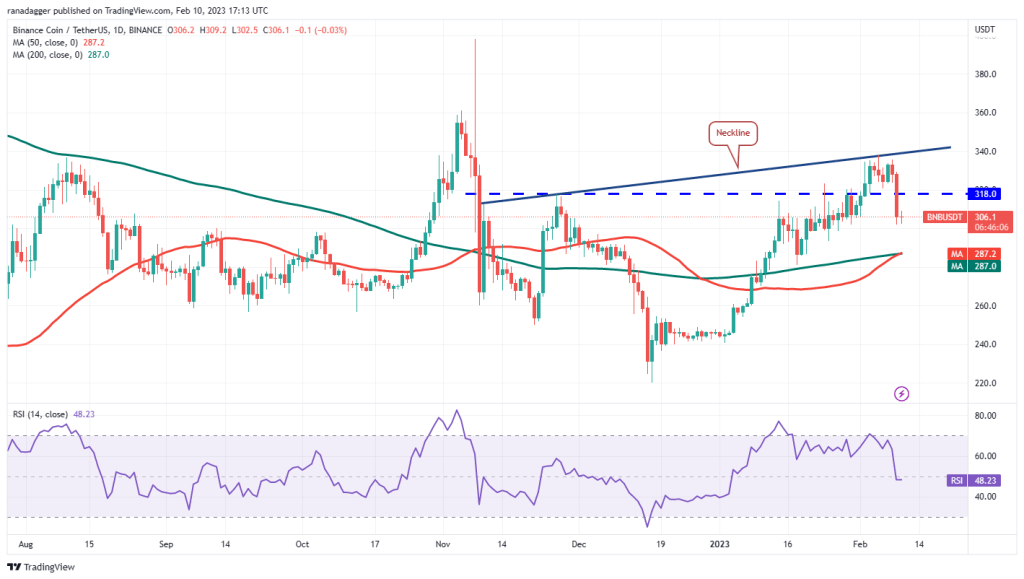
The bulls are likely to zealously defend the moving averages. If the price bounces back strongly from this support, the BNB/USDT pair may form an inverted head and shoulders pattern, which will complete in a breakout and close above the neckline. This bullish reversal setup has a target target of $440.
On the other hand, if the price drops below the moving averages, selling could intensify and the pair could drop to $240.
XRP/USDT
XRP broke below support on February 9 after staying above the 200-day SMA ($0.39) for several days. This suggests that the bears are trying to take control.
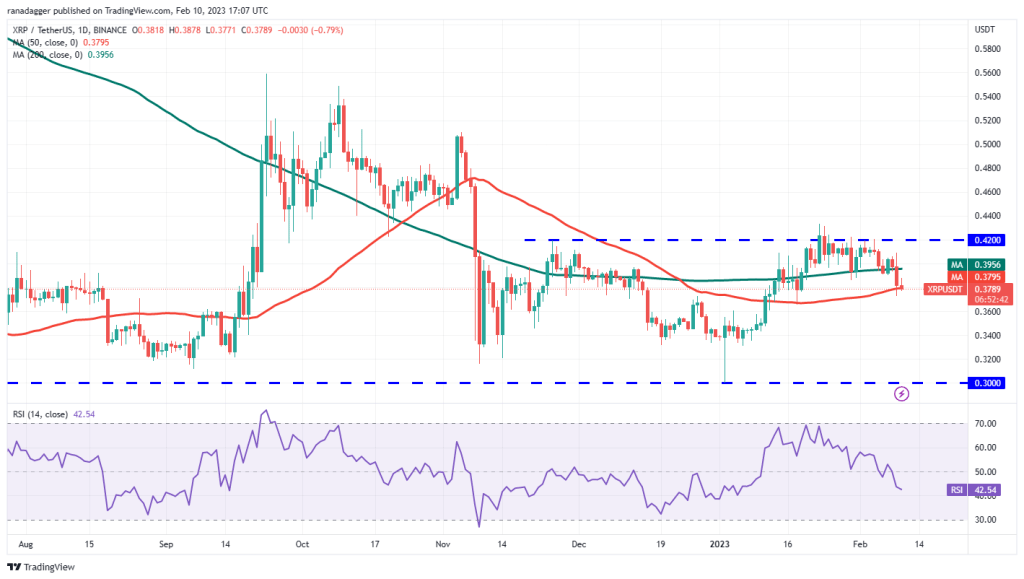
The 50-day SMA ($0.38) acted as a strong support on Jan. 18 and the bulls are trying to hold the level again. If the price bounces up from the current level and rises above the 200-day SMA, this will imply strong demand at lower levels. Buyers will then aim to clear the $0.43 barrier and start a rise towards $0.51.
Conversely, if the 50-day SMA collapses, it will signal that the bears are back in the driver’s seat. The XRP/USDT pair could drop to $0.33 later.
ADA/USDT
The 200-day SMA ($0.39) acted as a strong hurdle for Cardano. Although the bulls pushed the price above the resistance several times, they failed to gain strength.
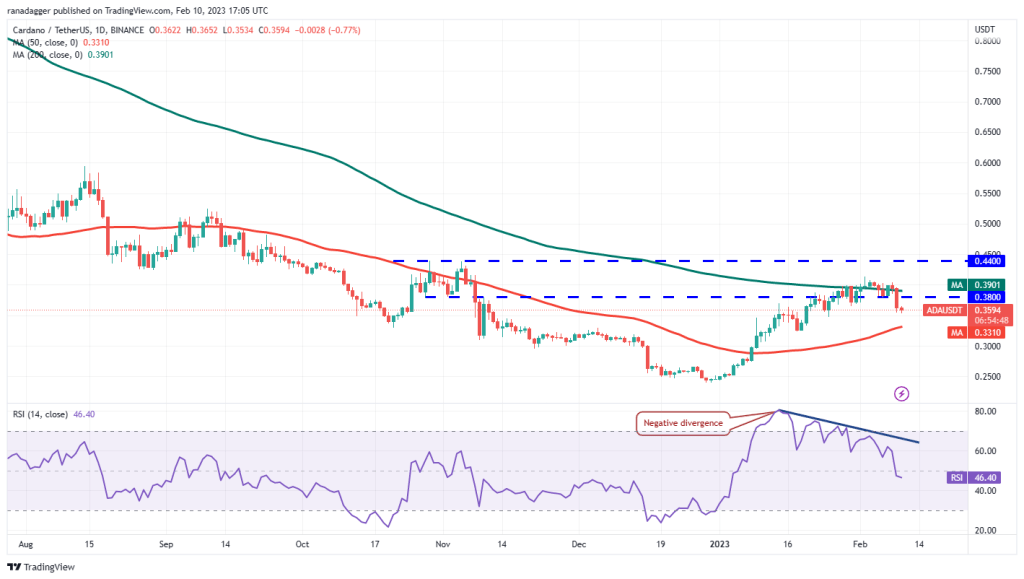
The price declined and broke below the $0.38 support on February 9. Sellers will try to pull the price towards the 50-day SMA ($0.33), which will likely act as strong support. If the price bounces back strongly from the 50-day SMA, it will indicate that the bulls are attempting to form a higher bottom.
On the upside, buyers will need to overcome the zone between the 200-day SMA and $0.42 to signal a potential trend reversal. This could increase the probability of a rally above $0.44.
DOGE/USDT
Dogecoin broke below the $0.09 support and reached the 50-day SMA ($0.08). This drop pulls the RSI into negative territory, showing that the momentum is shifting in favor of the bears.
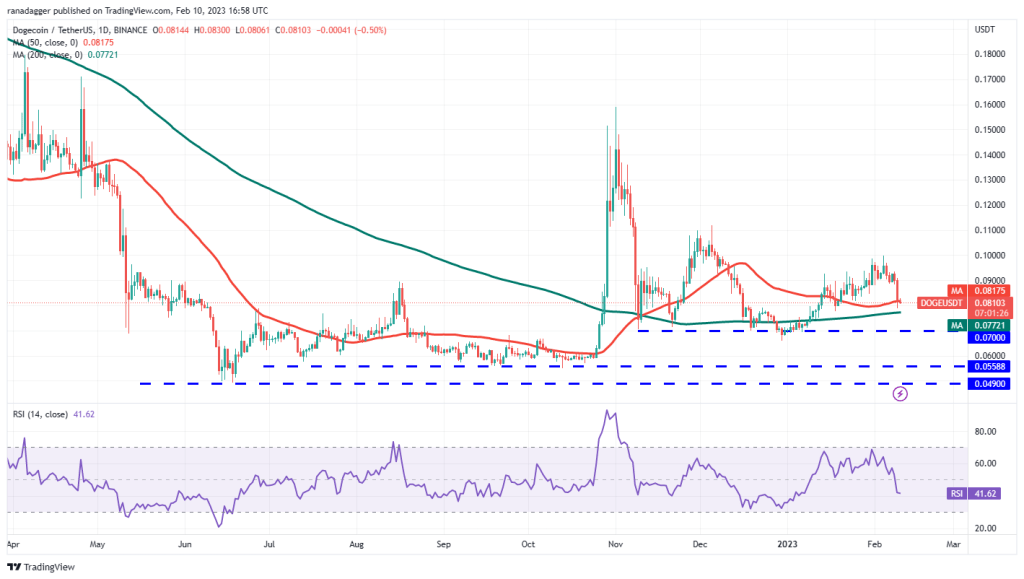
The bulls will have to defend the area between the moving averages with all their might because if they don’t, the DOGE/USDT pair could drop to the crucial support near $0.07. If the price bounces back from this level, the pair could consolidate between $0.07 and $0.10 for a few days.
If the price bounces back strongly from the current level, it will show that the bulls are struggling to turn the 200-day SMA ($0.08) to support. If they do, the pair could start its journey towards $0.10.
MATIC/USDT
Buyers pushed Polygon above the overhead resistance of $1.30 on February 8 and 9 but failed to sustain the breakout. This indicates that the bears are selling the rally above $1.30.
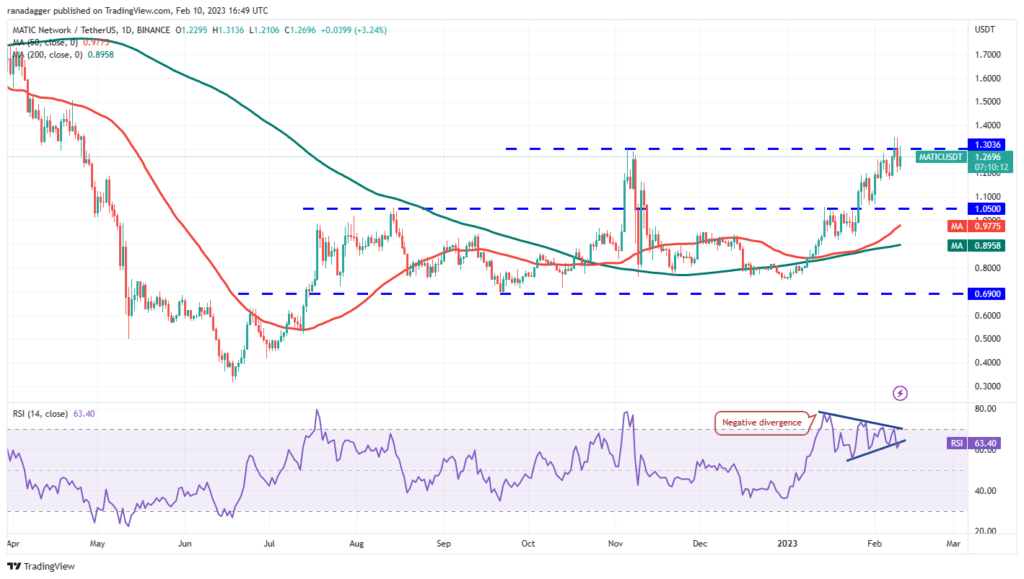
However, a positive sign is that the bulls have not left much room for the bears. This suggests that shallow dips attract buyers. This increases the likelihood of a rally above $1.30. If this happens, the MATIC/USDT pair could rally to $1.45 and then $1.70.
On the contrary, if the price breaks down from the overhead resistance once again, it will show that the bears continue to vigorously hold the $1.30 level. The bears will have to push the price below $1.16 to retest $1.05.
LTC/USDT
Litecoin dropped from $102.50 in February. This suggests that failure to break the resistance may have encouraged short-term traders to record profits.
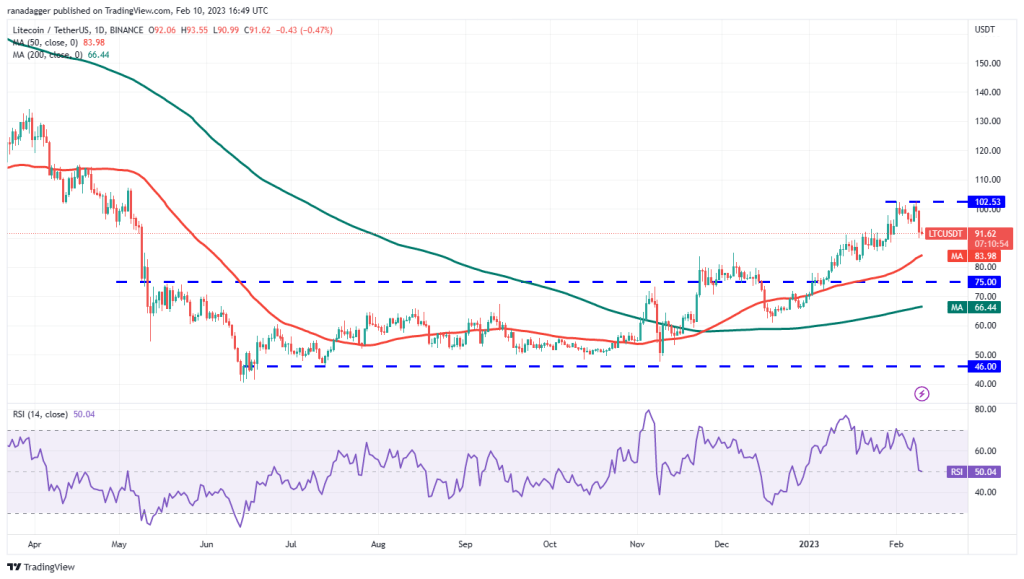
The bulls will try to stop the decline from the immediate support at $88, while the bears will try to pull the LTC/USDT pair to the 50-day SMA ($84). A deeper dip would indicate that the momentum is weakening and this could delay the resumption of the uptrend.
If the bulls want to continue the uptrend, they will have to quickly push the price above $98. This will signal a positive sentiment that traders are buying from the dips. The bulls will then try to break through the $102.50 barrier again and start the next leg of the uptrend towards $115.
DOT/USDT
The failure of the bulls to push Polkadot above $7.25 may have pulled short-term traders’ selling, which in turn pushed the price to the 200-day SMA ($6.33).
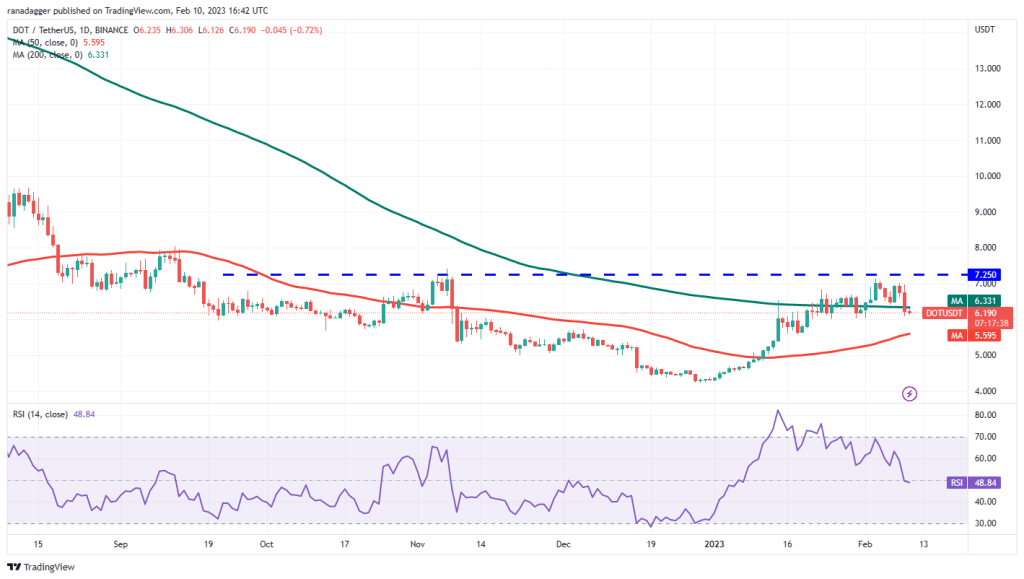
Buyers will try to stop the decline in the zone between the moving averages, making it a higher low. If they are successful, this will indicate that the DOT/USDT pair has started a bottom formation. A break and close above $7.25 could attract more buying and open the doors for a possible rally to $10.
Conversely, if the price dips below the 50-day SMA ($5.59), it will indicate that the bears are back in control.
AVAX/USDT
Avalanche (AVAX) bounced back from overhead resistance at $22 and reached the 200-day SMA ($17.88). Buyers are expected to defend the zone between the moving averages.
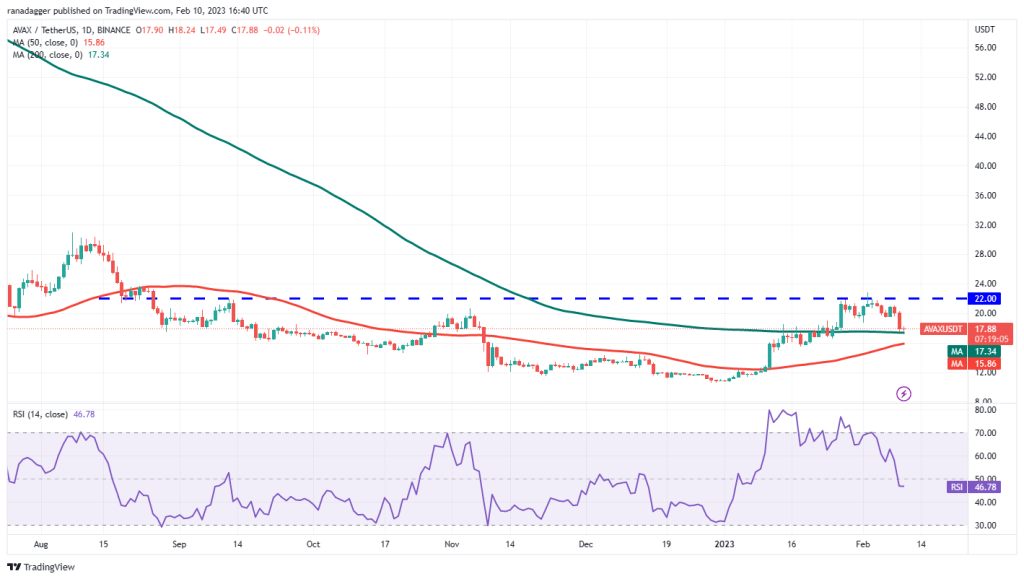
If the price bounces back from the current level, the bulls will make another attempt to push the price above $22. If they do, the AVAX/USDT pair is likely to gain momentum and rally to $30.
Another possibility is that the price bounced back from the moving averages but failed to rise above $22. This can cause a consolidation for several days. The bears will have to push the price below the 50-day SMA to gain an edge over AVAX.