Crypto analyst Rakesh Upadhyay states that Bitcoin (BTC), in particular, SHIB, DOGE, ETH and other altcoins make an occasional relief rally, but technical analysis shows that the dominant trend will remain bearish for a while. Can Bitcoin and altcoins break below their recent lows or will the bulls be able to successfully defend the supports? To find out, the analyst considers 10 leading cryptocurrencies. We have prepared Rakesh Upadhyay’s analyzes for our readers in his own words.
BTC, ETH, SHIB and an overview of altcoins
As you can follow from cryptokoin.com news, the leading crypto Bitcoin (BTC) remains tight with the markets, especially as US stock markets remain in a solid bear trend. The Dow Jones Industrial Average is on track for its eighth consecutive negative week and the S&P 500 is close to diving into bear market territory.
Celsius (CEL) CEO Alex Mashinsky believes Wall Street short sellers are looking for any weaknesses in crypto companies to “short and destroy”. Mashinsky accused the ‘Sharks of Wall Street’ of trying to crash Terra (LUNA) and destabilize Tether (USDT) and ‘many other companies’ including Maker (MKR) and Celsius.
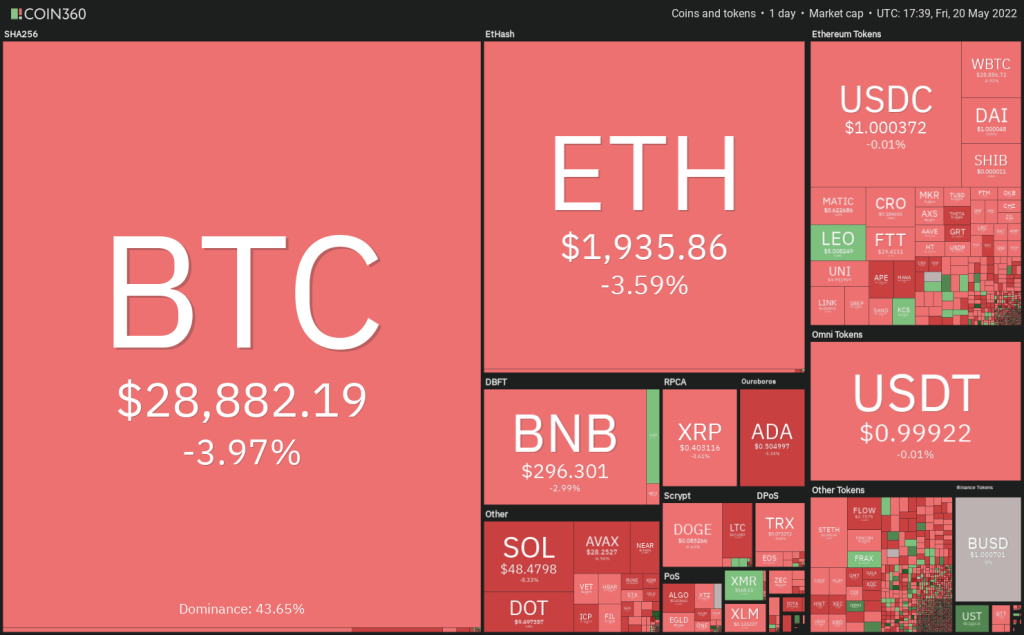 Daily cryptocurrency market performance / Source: Coin360
 Although bear markets are painful in the short term, they tend to be good buying opportunities for long-term investors. However, it is important to remember that not all cryptocurrencies will return to their former glory when the next bull run begins.
Every bull market usually has a new leader group. Therefore, traders should try to identify the cryptocurrencies that are leading the market rather than buying the ones that are left behind. Nic Carter expresses this very well when he says that not everything will return and that “some things die permanently”.
BTC, ETH, BNB, XRP and ADA analysis
Bitcoin (BTC)
Bitcoin recovered strong support at $28,630 on May 19, but the bulls failed to push the price above the downtrend line. This shows that the bears have not given up yet and continue to sell in the rallies.
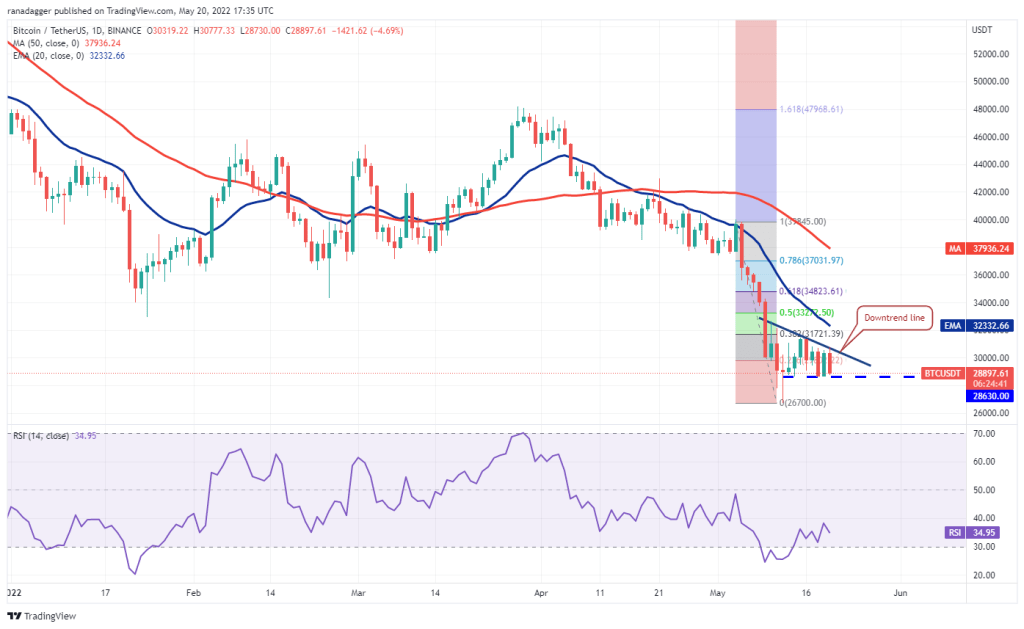
The bears will try to push the price below $28,630. If they do, BTC could drop to the intraday low of May 20 at $26,700. This is an important support for the bulls’ defense because if they don’t, BTC could continue its bear trend. The next support on the downside is $25,000 followed by $21,800.
Contrary to this assumption, if the price bounces off $28,630 and rises above the bearish trend line, it will suggest strong accumulation at the lower levels. Buyers will then try to push the price higher to the 20-day exponential moving average (EMA) ($32,332). If the bulls break this hurdle, BTC could rally to the 61.8% Fibonacci retracement level at $34,823.
Ethereum (ETH)
The bears pulled Ethereum (ETH) below the immediate support at $1,940 on May 18 and 19 but failed to capitalize on the move. The bulls bought the dip but failed to push the price towards the overhead resistance at $2,159.
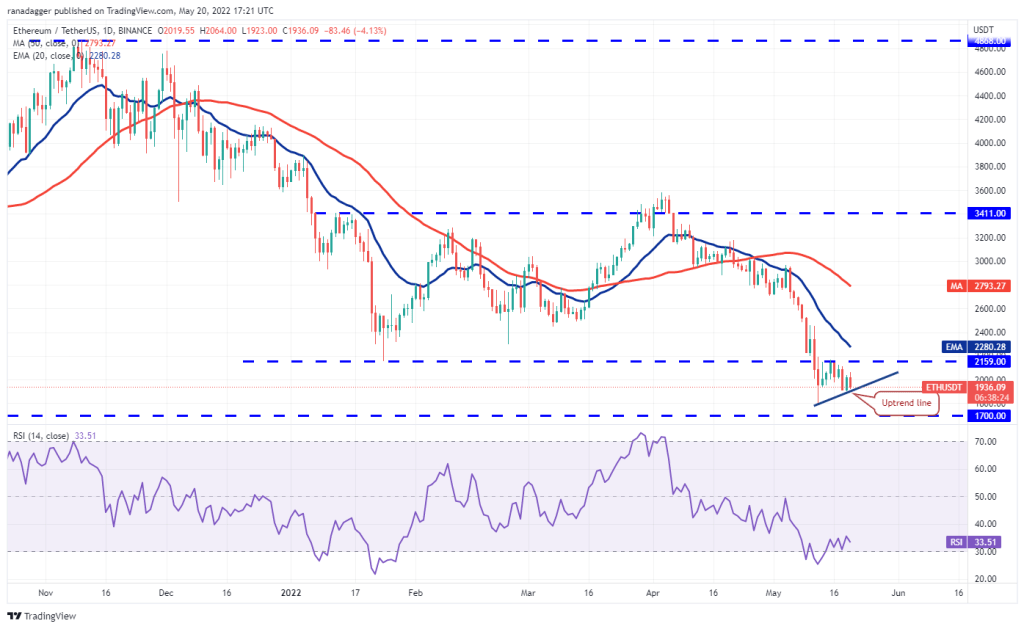
Strong selling at higher levels pushed price to bullish line on May 20. If ETH breaks below the bullish line, the decline could extend as far as the critical support at $1,700. The bears will have to push ETH below this level to suggest the start of the next leg of the downtrend.
Contrary to this assumption, if the price rises from the current level or $1,700, dips will suggest buying. ETH will then make another attempt to break the overhead barrier at $2,159. If they do, it suggests ETH might have bottomed out.
Binance Coin (BNB)
BNB has been consolidating near the overhead resistance at $320 for the past few days. A tight consolidation near a stiff resistance shows that the bulls are not abandoning their positions as they wait for the recovery to continue.
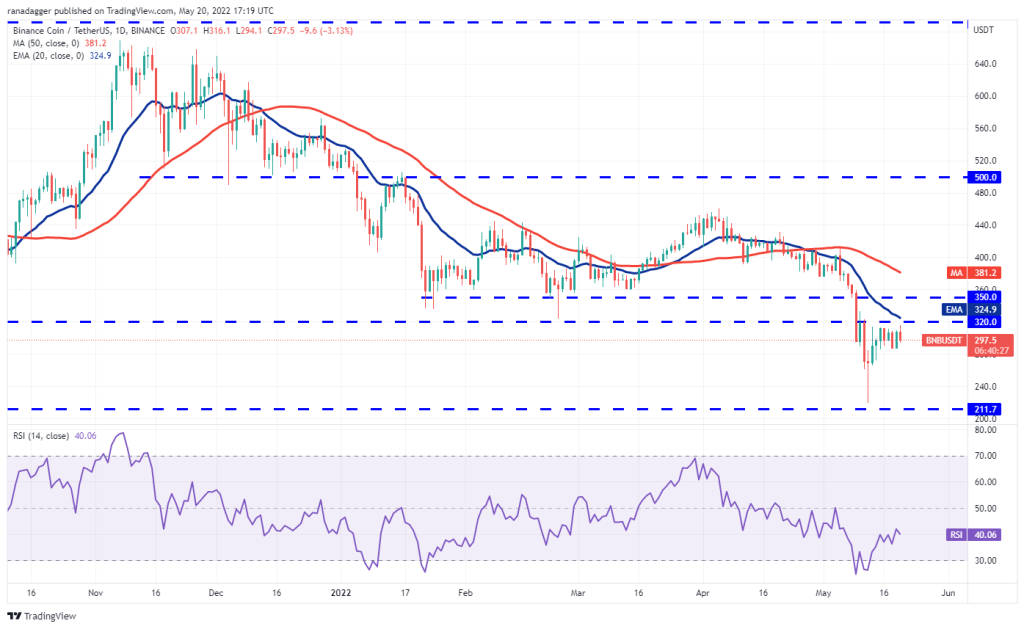
If the bulls propel the price above the overhead resistance zone between $320 and the 20-day EMA ($326), BNB may have bottomed. BNB could then begin its northward journey towards the 50-day simple moving average (SMA) ($381).
Conversely, if the price drops from overhead resistance and dips below $285, it means the bulls have given up and can close their positions. This could push BNB to $265 and then to the critical support at $211.
Ripple (XRP)
Ripple (XRP) bounced off the $0.40 to $0.38 support zone on May 19, but the bulls overall resistance is 0.45 He couldn’t clear the dollar. This shows that while the bulls are buying on the dips, the bears are maintaining their selling pressure near the general resistance levels.
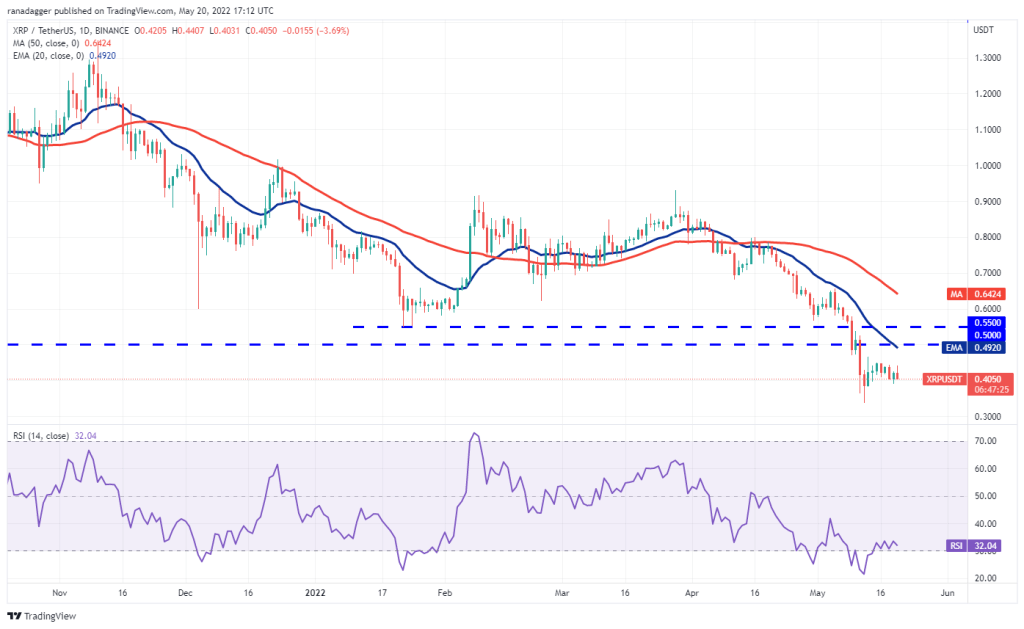
If the price continues to drop and breaks below $0.38, XRP could drop to $0.33. This is an important level to consider because a break below this could restart the bear trend. XRP could drop to $0.24 later.
Contrary to this assumption, if the price breaks out of the support zone once again, buyers will try to push the pair to $0.50. A break and close above this level will be the first indication that XRP could bottom. The next stop on the upside could be the 50-day SMA ($0.64).
Cardano (ADA)
The bulls are trying to defend the $0.50 support on Cardano, but the bears are not in the mood to give up their advantage and continue to sell on every small rally.
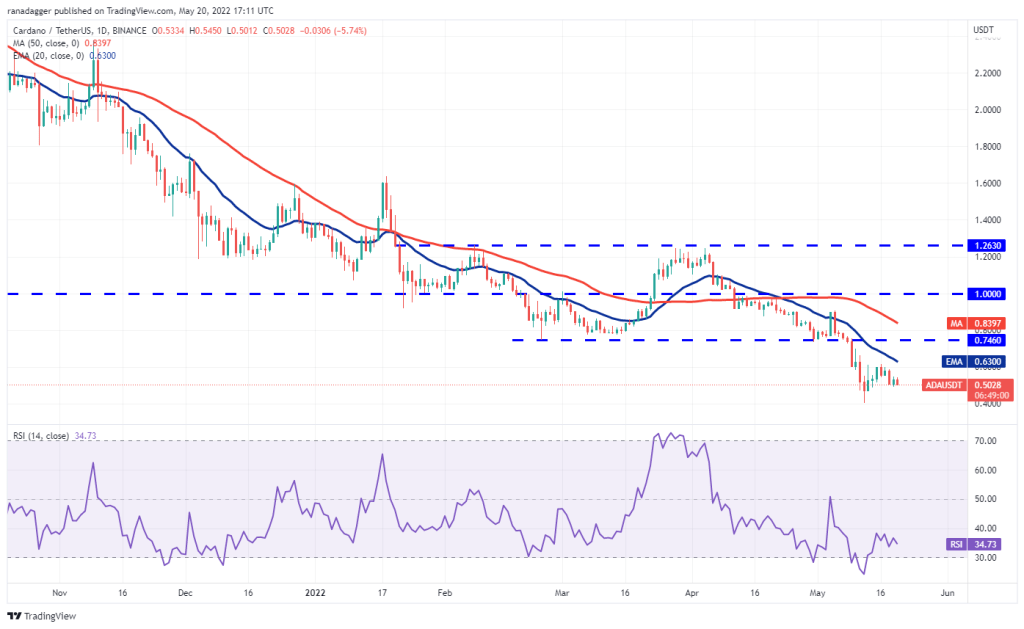
If price drops below $0.50 and sustains, ADA may retest critical support at $0.40. This is an important level for the bulls to defend, as a break below it could signal a resumption of the downtrend. ADA could then go to $0.33 and then $0.28.
Contrary to this assumption, if the price rises from the current level, buyers will try to push the ADA above the 20-day EMA ($0.63). If they manage to do so, it will suggest that selling pressure may drop. ADA could then rise to the breakout level at $0.74.
SOL, DOGE, DOT, AVAX and SHIB analysis
Solana (SOL)
Solana in a strong bear trend . The bulls’ attempts to start a recovery on May 19 failed as the bears continued to sell higher. The bears pulled the price back below the psychological level at $50 on May 20.
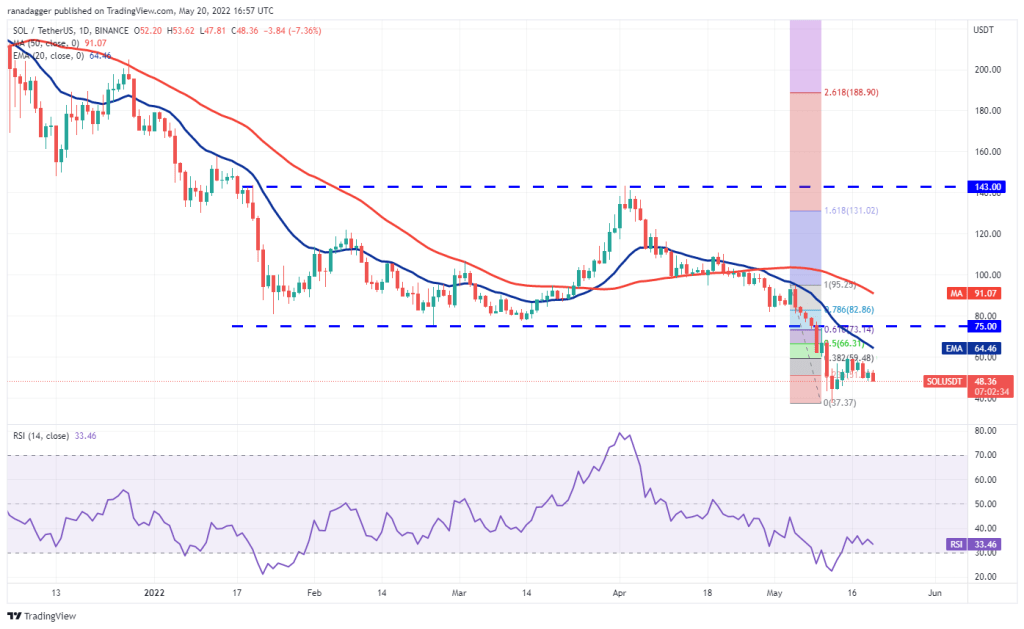
If the price continues to decline, it could drop LEFT to $43. This level could act as a strong support but if the bears pull the price below it, the next stop could be at $37. If this level is also broken, the drop could be extended to $32.
On the contrary, if the price rises sharply from the current level or support, it will suggest bulls’ accumulation. Buyers will then try to push the pair to the 20-day EMA ($64). A break and close above this level could open the doors for a possible rally to $75.
Dogecoin (DOGE)
Dogecoin bounced off the immediate support at $0.08 on May 18, but the recovery continues to face selling at higher levels. This shows that sentiment is negative and traders are selling on every small increase.
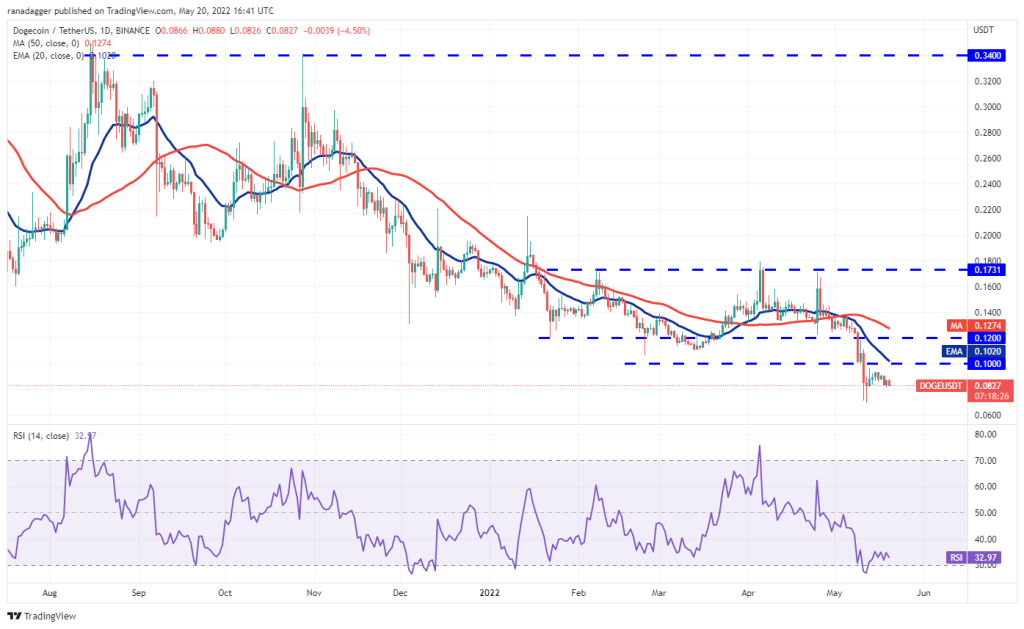
If the price continues to drop below $0.08, the bears will take their chances and DOGE will attempt to push the May 12 intraday low below $0.06. If they do, the next leg of the bear trend could begin and the DOGE could drop to $0.04.
This downside could be invalidated in the short term if the price bounces off the current level or below support and spikes above the psychological resistance at $10. Such a move could open the doors for a rebound to the 50-day SMA ($0.12).
Polkadot (DOT)
Polkadot fell below $10.37 on May 18, but the bulls bought this drop and pushed the price above the level on May 19. worked. However, the bears held their ground and are trying to turn $10.37 into resistance.
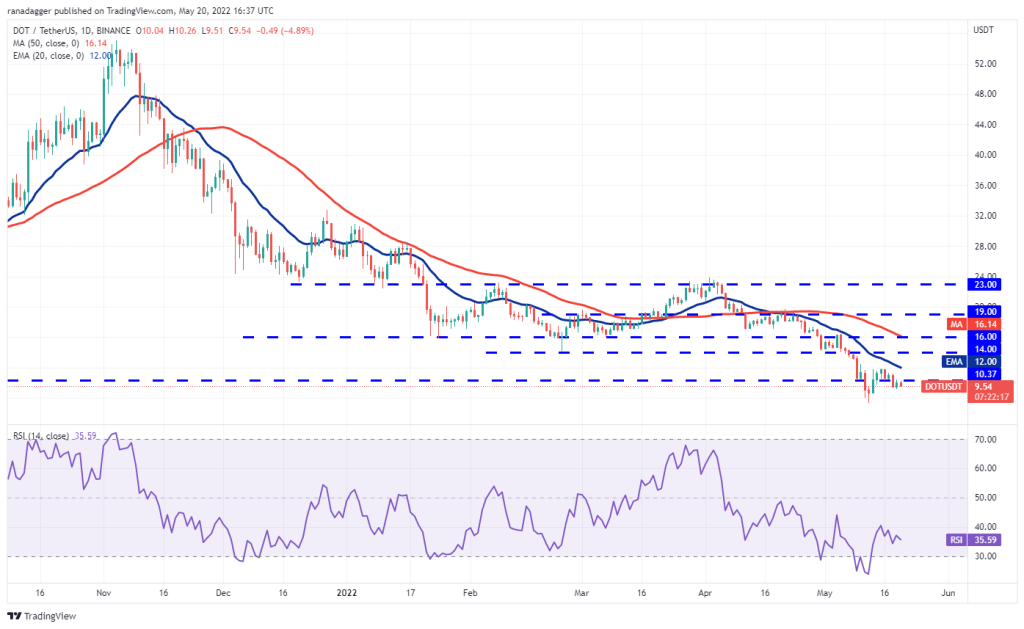
If the price drops below $9.22, the DOT could retest the support zone between $8 and $7.30. The bears will have to push and sustain the price below this zone to signal the resumption of the downtrend. The next support on the downside is $5.
Conversely, if the price bounces back from the support levels, the bulls will try to push the price towards the 20-day EMA ($12). This level can act as a strong resistance, but if the bulls break through this hurdle, it suggests that the sellers may be losing control. The DOT may then attempt a rally to the 50-day SMA ($16).
Avalanche (AVAX)
AVAX is in a bear trend. Price action over the past few days has formed a pennant that often acts as a continuation pattern.
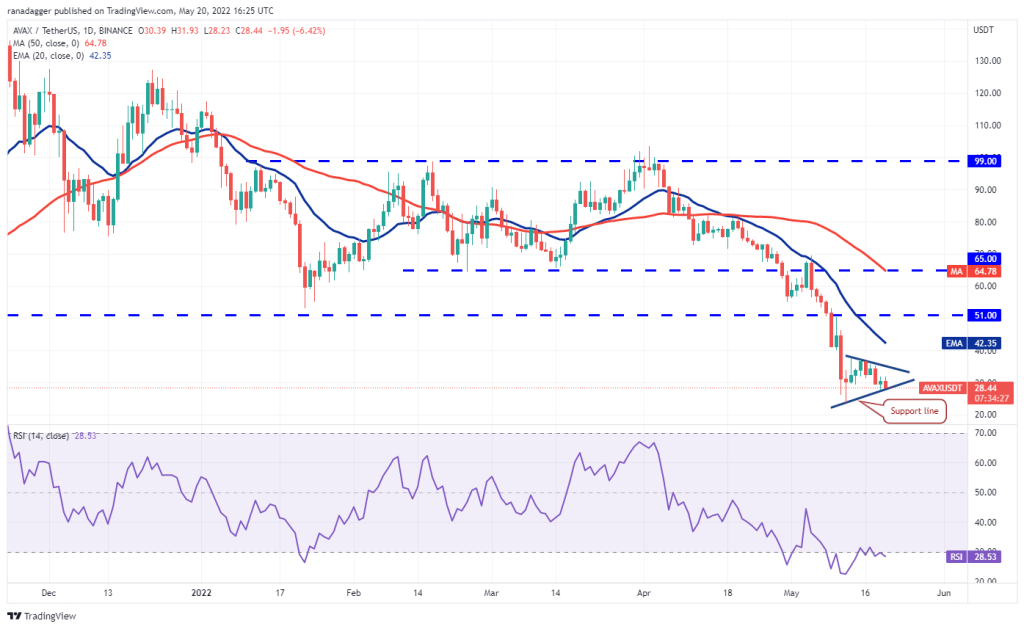
If the price drops below the support line of the pennant, AVAX may retest the critical support at $23.51. A break and close below this level could signal a resumption of the downtrend. AVAX could drop to $20 and then to $18.
Alternatively, if the price rises above the current level, buyers will try to push the pair above the pennant. If they do, the pair could gain momentum and climb to the 20-day EMA ($42.35). The bulls will have to break through this hurdle to challenge the breakout level at $51.
Shiba Inu (SHIB)
SHIB has been stuck between $0.000010 and $0.000014 for the past few days, showing the indecision between the bulls and bears. This means that the bulls are trying to make a bottom, but the bears are not letting the rebound continue.
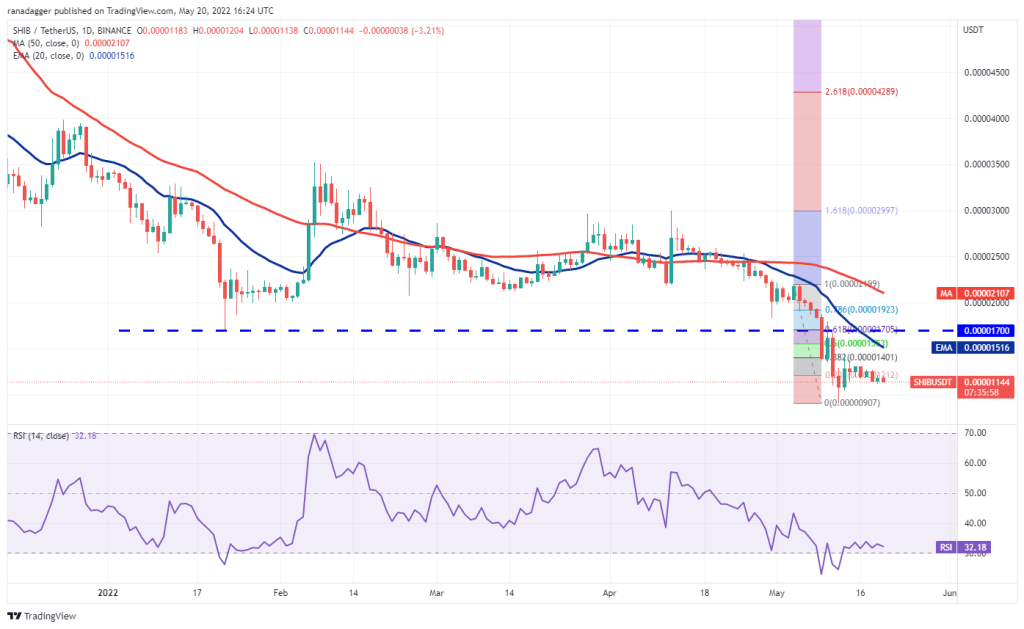
If SHIB price rises above $0.000014, it indicates that the bulls are absorbing the supply. This could open the way for a possible rally to $0.000017 where the bears could pose a strong challenge again. The bulls will have to break this resistance to indicate a potential trend change.
Contrary to this assumption, if SHIB price drops below $0.000010, SHIB could slide from $0.000009 to the May 12 intraday low. If this support is broken, the drop could extend to $0.000007 and then to $0.00005.