
According to analysts, Filecoin offers a buy signal before it explodes 24%. Analyst Akash Girimath says Monero is preparing a potential exit. According to analysts, Ethereum stakers have high trust in the altcoin. So, can this altcoin catalyze the price rally? Analyst Filip L predicts a 40% boom for Solana price action. Analyst Ekta Mourya assesses the rally potential of the Shiba Inu.
This altcoin is considering its next move
Filecoin (FIL) is down 14% in the last five days after falling below the 200-day Exponential Moving Average (EMA). Currently the FIL is consolidating at $5,932, which is a support combination of the horizontal level and the 50-days EMA, and the 200-days EMA is acting as an immediate resistance level at $5,932. Buying pressure exceeding this level will pave the way for investors to recoup some of the losses they have suffered since February 19.
If buyer appetite does not exceed the aforementioned level, the FIL may tag the $6,998 resistance level or, in highly assertive cases, reach the $7,254 resistance level. Such a move would mean a 24% increase in the altcoin price from its current position of $5,890. Additionally, a bullish divergence has been noted between the FIL price making lower lows and the RSI making higher lows on the four-hour timeframe. This mismatch often causes the price of the underlying asset to break up. In this case, the FIL could ideally initiate a rise of 24% as stated above.
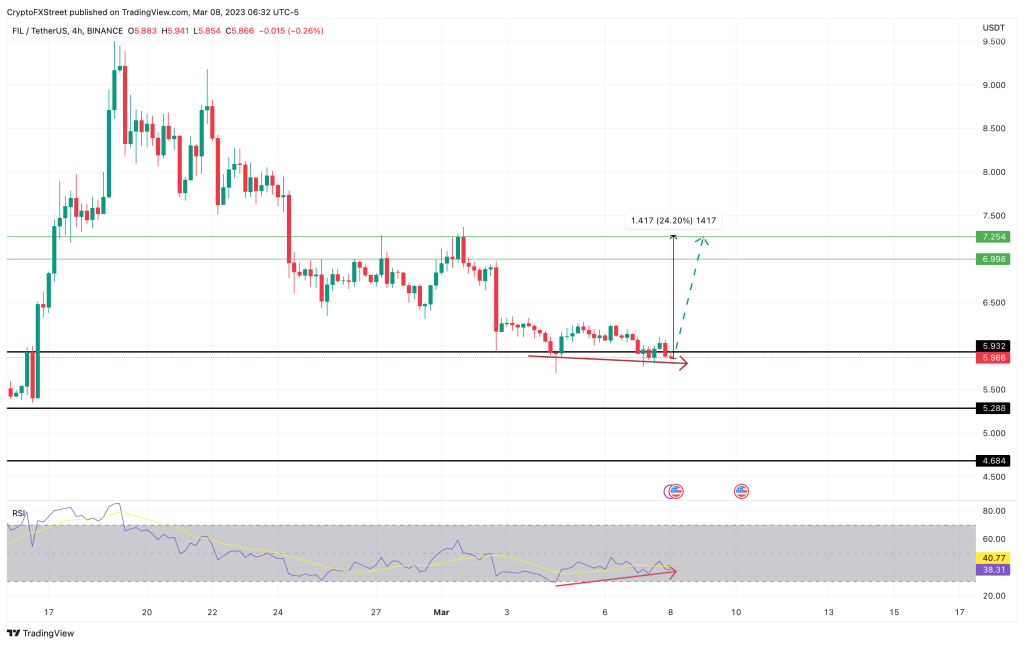 FIL 4-hour chart
On the downside, taking profits could spoil the altcoin price’s bullish outlook. In the midst of the current FUD in the market, investors may resort to taking early profits. Such a scenario could lead to a selling frenzy that would cause the FIL price to lose the support combination of the 50-day EMA and the immediate support level at $5,932. Additionally, a daily candle close below the said level will increase buyers’ distress and invalidate the bullish argument. A bearish view requires the FIL to drop below the $5,288 level or the $4,684 support level. In extreme cases, the price could drop to the $4,000 low.
XMR is waiting for the right time
The altcoin formed a local top at $187 on Jan. 14 and formed another swing higher at the same level to push higher. The push failure signaled a possible takeover from the bears. Since that point, XMR has lost 20% and is trading at $149 at the time of writing. On its decline, Monero price sets multiple low lows and lower highs, as seen in the chart below. Connecting these swing points using trend lines reveals a falling wedge pattern. A definitive break above this setup will usually trigger a bullish retest aimed at a retest of previous swing highs.
In Monero’s case, the most obvious volatility is at $169, where many buys are likely resting. Additionally, the existence of a Fair Value Difference (FVG) stretching from $168 to $170 makes it a better target for bulls. However, for this impressive rally to begin, the altcoin price must clear the immediate $153 hurdle. Successful conversion of this resistance level to a support base will give the sidelined buyers the necessary confidence to step up. In such a case, traders can expect XMR to trigger a 10% move to $179. In a fairly high bullish situation, this upside could push Monero price to tag the local top and rally the buy-stop liquidity at $187.
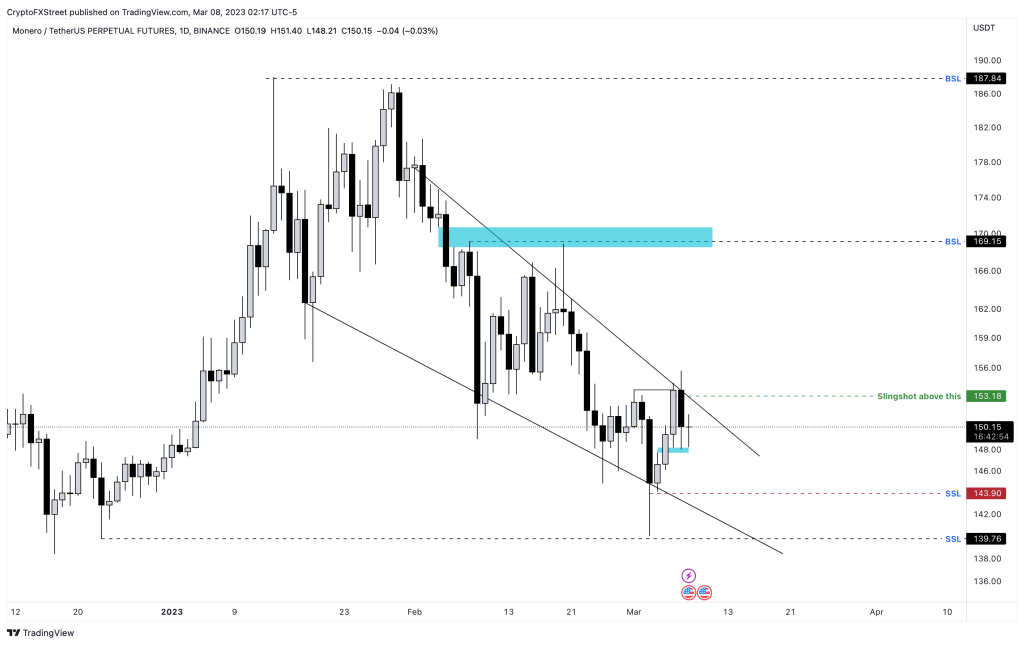 XMR 1-day chart
No matter how positive the Monero price setup looks, traders should avoid taking an early step to open long positions. Sell stops below $143 are crucial and will likely be swept before the uptrend begins. If buyers lose control during a sell-stop liquidity raid, resulting in this hurdle turning into a support base, this invalidates the bullish thesis. In such a case, the Monero price could drop 3% and tag the next liquidity pool at $139.
Is there a paper rally for the leading altcoin?
As the Ethereum Shanghai upgrade approaches, stakers are pouring altcoins into the ETH2 deposit contract. According to data from crypto intelligence tracker Nansen, the total number of Ethereum tokens invested in the contract rose to 17.52 million.
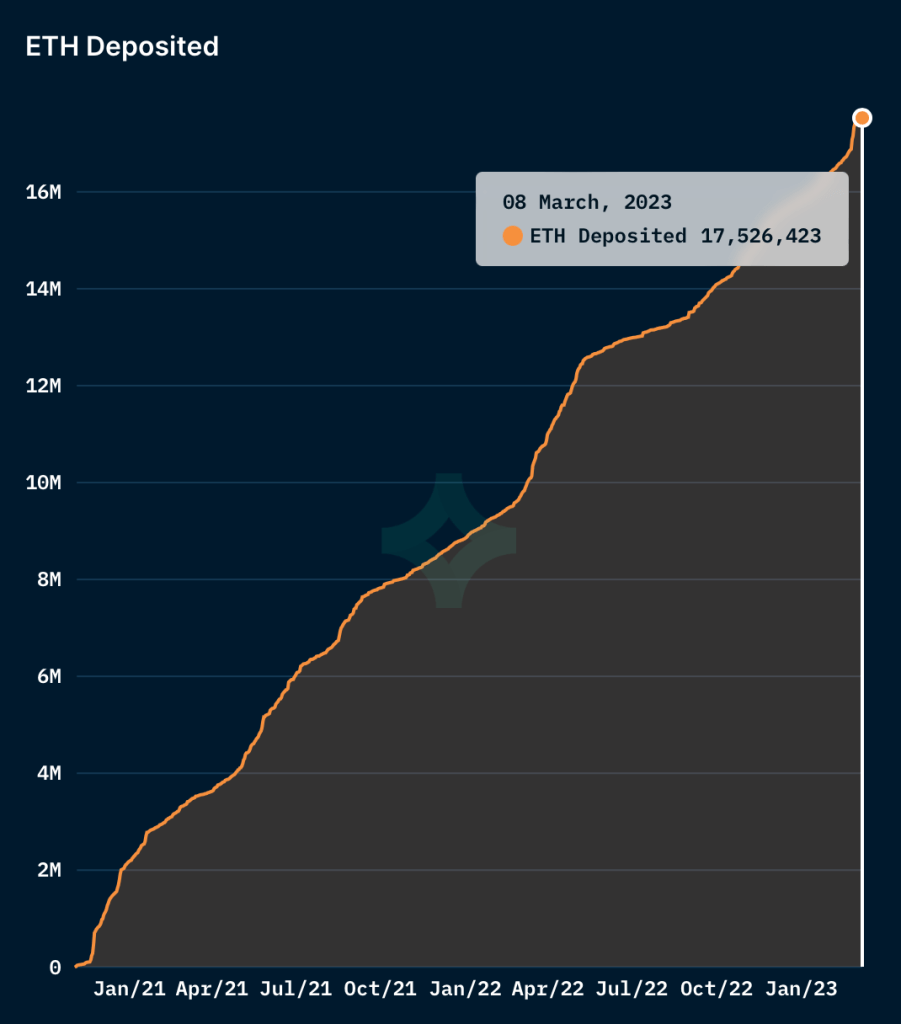 ETH2 deposit contract
According to experts from crypto intelligence tracker Santiment, Ethereum 2.0 stakers have seen an erosion in price that has taken place over the past 10 weeks. Analysts at Santiment note that long-term stakers dropped an average of 31%. Despite unrealized losses, the volume of ETH staked continues to rise. The Ethereum network recently surpassed 1.9 billion transactions. This marks an important milestone for the altcoin’s journey. The altcoin stayed above the $1,553 level after the last drop from $1,600 on March 3.
 Money in/out Ethereum
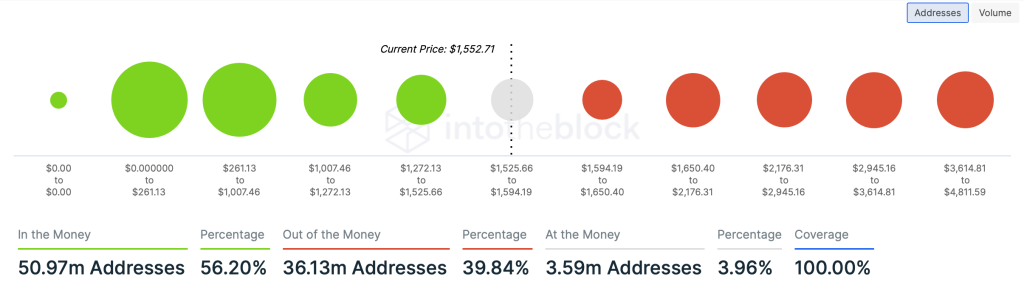
According to data from IntoTheBlock, the $1,525 level is key support for Ethereum, as 5.93 million wallet addresses have accumulated between $1,272.13 and $1,525 in ETH. If the $1,525 support wall holds, the altcoin could climb higher.
Bulls drop ball in Solana
Solana price was on a very steep slope at the beginning of 2023 with a strong recovery above $25 at one point. Unfortunately, the SOL bulls started to take a lot of profits and the bearish dips got bigger. Add to that another challenge to the dimpled image that cryptocurrencies are on the verge of collapse and default with Silvergate Capital, and you have an excellent explanation for why SOL is now flirting with a bear market.
The SOL could start to see an acceleration in sell orders once $18.66 starts to break. The bulls will first want to take a quick dive towards $15.07 and reserve the remaining profit they can get from the 20% devaluation. Once at this level, it looks like a slow decline to lose another $5 in value and touch $10.94 later this month.
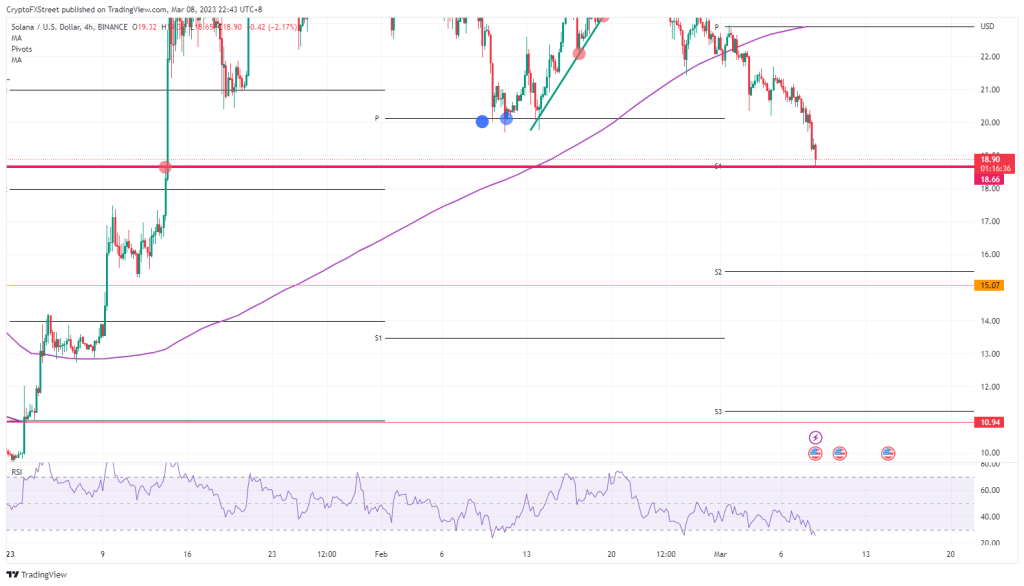 LEFT 4-hour chart
Since the Relative Strength Index (RSI) is already deep in the oversold zone, a tactical approach might be to stay calm and start buying the SOL. This means that the bears are not expecting any further declines and instead a bounce at $18.66 will be seen. The ideal candidate on the upside is the 55-day Simple Moving Average at $23 and the monthly pivot, which aligns and forms a double border at the top.
Will the launch of Shibarium trigger a 65% rise?
According to data from crypto intelligence tracker IntoTheBlock, the next key resistance for the Shiba Inu is the area between $0.000014 and $0.000020. This is key territory as 98,240 addresses bought 469.97 Trillion SHIB tokens at this level.
 Global Money In/Out
When the altcoin price climbs into the region between $0.000014 and $0.000020, wallet addresses that buy SHIB at this price level will become profitable. These SHIB wallet holders will sit in unrealized profits when Shiba Inu turns resistance into support. The Shiba Inu may find intermediate support at $0.00000961 as seen on the SHIB one-day price chart below. Buy-side liquidity is expected to come in at $0.00000772. The bullish targets on the Shiba Inu’s rise are $0.00001581 and $0.00001797 as seen in the chart below.
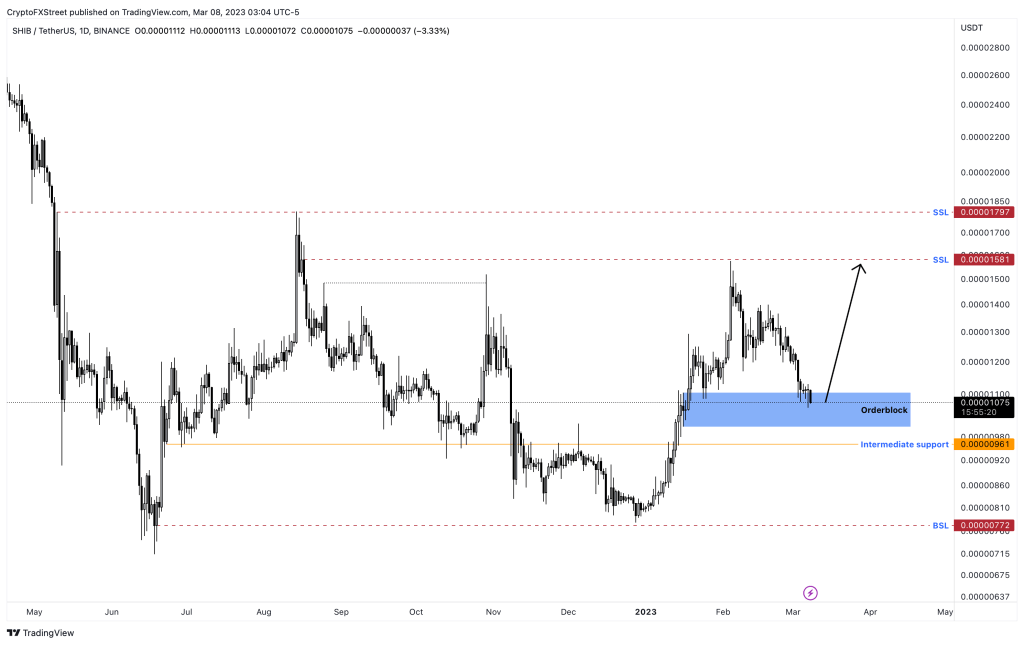 SHIB 1-day price chart