
In the crypto currency market, the Tron (TRX) price is steadily rising and maintaining $ 0.24 support. After the last decline, TRX recovered after the 21 -day moving average. However, it is difficult to overcome the 50 -day moving average resistance. If it breaks this critical level, a strong rise movement can be triggered for $ 0.30.
TRx Technical View: Stuck Price Movement
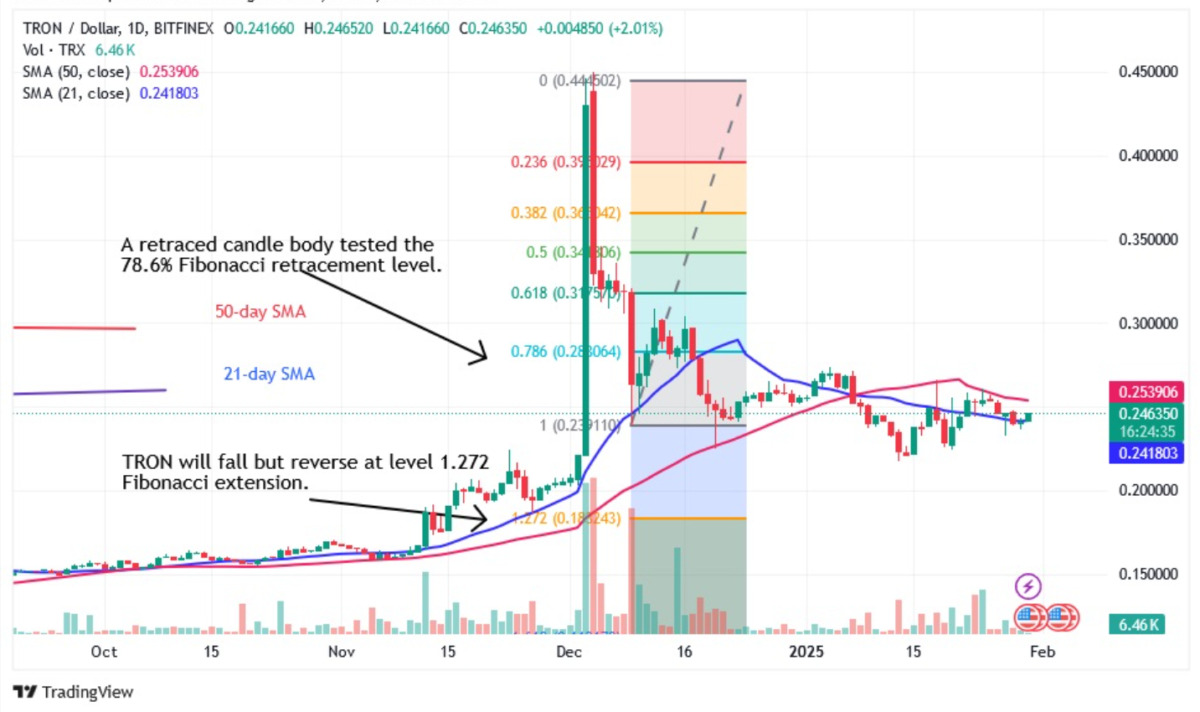
Tron recently received a upward reaction from $ 0.217 support and is currently trading at $ 0.245. However, the 50 -day moving average (SMA) is still a significant point of resistance.
If Tron rises above the 50 -day SMA, bulls may be activated and the price may rise to $ 0.30. However, if it fails at this level, TRx may be trapped between moving averages for several days.
Critical levels for TRx price
- Resistance levels: 0.28 – 0.30 – 0.40 dollars
- Support Levels: 0.22 – 0.20 – 0.15 dollars
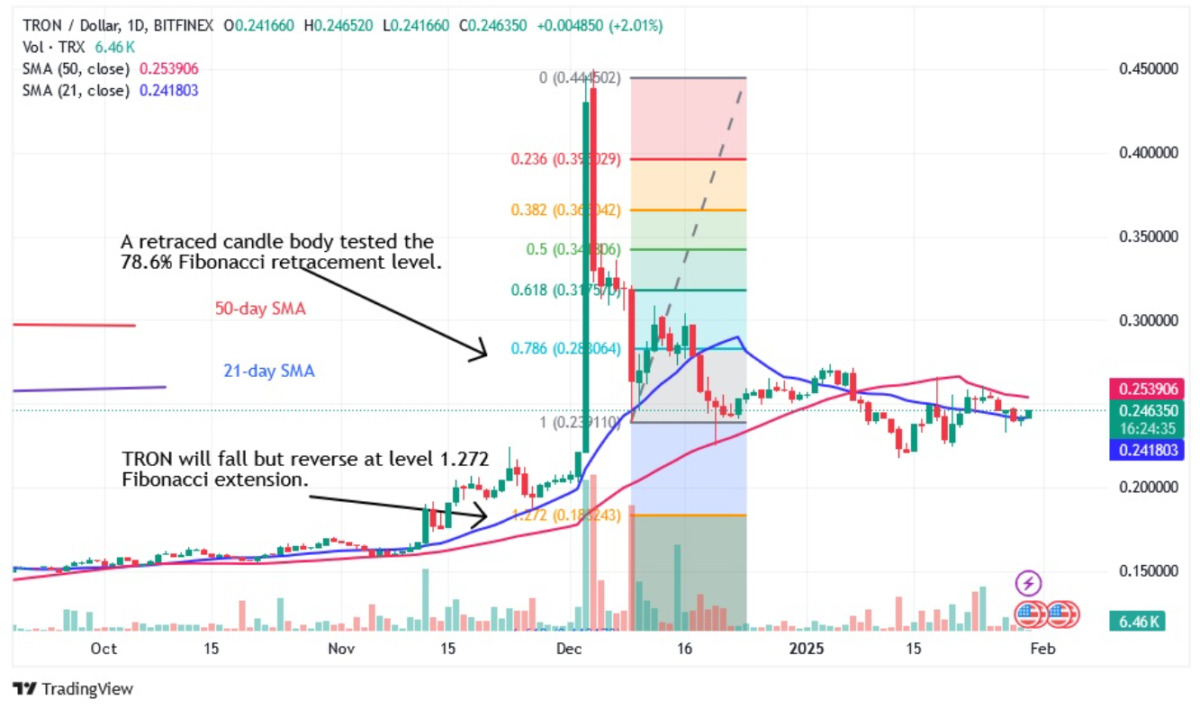
Price movements are currently shaped with Doji candle bars, which shows that the market is unstable. In order to determine the direction of TRX, investors closely follow these critical support and resistance levels.
Is the big break at the door in Tron? What levels should investors pay attention to?
Tron has been trading in a narrow price range for the last few weeks, but technical indicators have shown that a strong break is close. Momentum -winning TRX can reach $ 0.28 if it can break its 50 -day SMA level and then test $ 0.30. However, if the market uncertainty persists, TRx can fluctuate in the range of $ 0.22 – $ 0.28 for a while.

In particular, the point that attracts the attention of investors, the increase in volume and the mobile averages. Historically, such jams can be a harbinger of large price movements. If buyers gain strength, TRx may see an increase of up to 15 %in the short term. On the other hand, the fact that TRX cannot maintain $ 0.22 support in the decrease scenario may withdraw the price up to $ 0.20.
What’s next in Tron?
Tron is trapped in the 4 -hour graph in the range of $ 0.22 – $ 0.28. If the price exceeds the 50 -day moving average, TRx can reach $ 0.30 by entering the bull trend. However, if it encounters resistance at this level, the decrease trend may be strengthened again and the support of $ 0.22 can be tested.

In the coming days, Tron’s breaking movement will be decisive for investors. Can the bulls reach $ 0.30, or will the TRx return to the congested price movements again?