
Gold rally last Friday amid rumors that the Federal Reserve will slow down. However, gold prices fell on Monday as the dollar strengthened. Investors are looking for clues as to whether the Fed will pause monetary tightening. In this uncertainty environment, analysts’ gold forecasts point to further declines.
“I don’t think gold is out of control yet”
Spot gold fell 0.4% to $1,650.77 as of writing. U.S. gold futures were down 0.1% at $1,653.80. These days, there are expectations that some Fed officials are discussing a pause in the fast pace of rate hikes. Because, cryptocoin.com As you follow, gold jumped 1.8% on Friday. With this move, it reached its highest level since October 14 at the start of the session. Thus, it recorded its biggest daily increase since October 3.
Meanwhile, the dollar index (DXY) started the week with 0.4% gains. Thus, it reduced the attractiveness of dollar-priced gold for offshore buyers. City Index analyst Matt Simpson comments:
I don’t think gold is out of control yet. Gold’s move will depend on data from the Fed’s next meeting and clues as to whether it is close to pausing or continuing to tighten interest rates.
“We will probably look at the $1,500-1,600 range”
Markets expect the Fed to raise the overnight benchmark interest rate by 75 bps at its November meeting. Sharp US interest rate hikes increase the opportunity cost of holding unyielding gold. In this environment, gold prices have fallen more than 9% so far this year. Matt Simpson points out the following levels for his gold predictions:
If there is no Fed pivot and inflation continues to rise, we’ll probably look at the $1,500-1,600 range as we head into next year.
Important levels for gold predictions
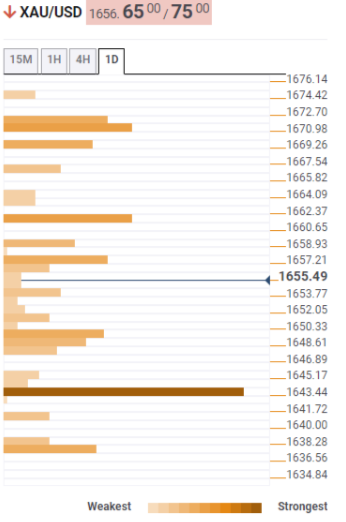
Market analyst Anil Panchal uses the Technic Confluence Detector (TCD) for gold forecasts. TCD shows that gold remains above the key $1,644 support despite the recent pullback from a one-week high. The indicated level consists of 38.2% Fibonacci one-day, 5-DMA one-month, and 23.6% Fibonacci one month.

Also, the convergence of the 50-HMA and Bollinger’s lower band in the four-hour game, as well as the weekly Fibonacci 61.8% convergence at around $1,636, acts as minor support. In a situation where gold prices exceed $1,636, the possibility of witnessing a drop to the latest low of around $1,617 and a yearly low to $1,614 cannot be ruled out.
Alternatively, it is possible for recovery moves to rally around the $1,662 level, which initially encompasses the 38.2% Fibonacci monthly. Following that, a daily pivot point R1, SMA 100 near $1,672 in the upper band of 4-hour and hourly Bollinger will be an important threshold to watch for fresh impulses as a breakout of the SMA 100 will quickly lead the gold bulls towards $1,700.
 Technic Confluence Detector
Gold predictions: Extra recoil possible
CME Group’s latest data for gold futures markets has arrived. The data showed that traders reduced their open interest positions by around 2.7k contracts after three consecutive days of increases on Friday. Instead, the volume continued its uptrend. Thus, approximately 111.7 thousand contracts were raised.
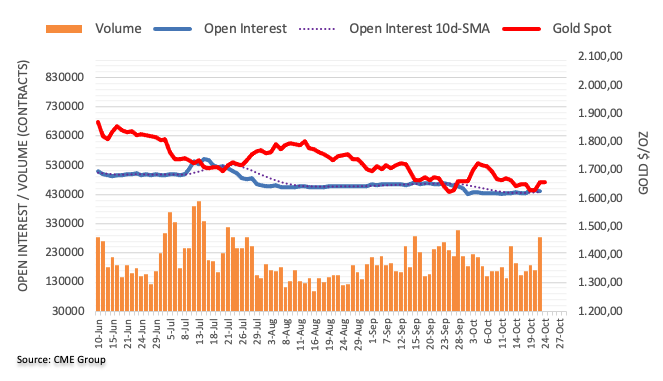
According to market analyst Pablo Piovano, Friday’s strong rise in gold prices was behind the lower open interest rate. This implied the possibility that a sustainable leap might be missed in the very near term. The analyst points to the $1,700 mark, an area that coincides with the 55-day SMA. He notes that this area continues to limit the upside for the time being.


